Immigrants from Honduras vs Immigrants from Eastern Africa Births to Unmarried Women
COMPARE
Immigrants from Honduras
Immigrants from Eastern Africa
Births to Unmarried Women
Births to Unmarried Women Comparison
Immigrants from Honduras
Immigrants from Eastern Africa
39.3%
BIRTHS TO UNMARRIED WOMEN
0.0/ 100
METRIC RATING
307th/ 347
METRIC RANK
31.0%
BIRTHS TO UNMARRIED WOMEN
72.1/ 100
METRIC RATING
157th/ 347
METRIC RANK
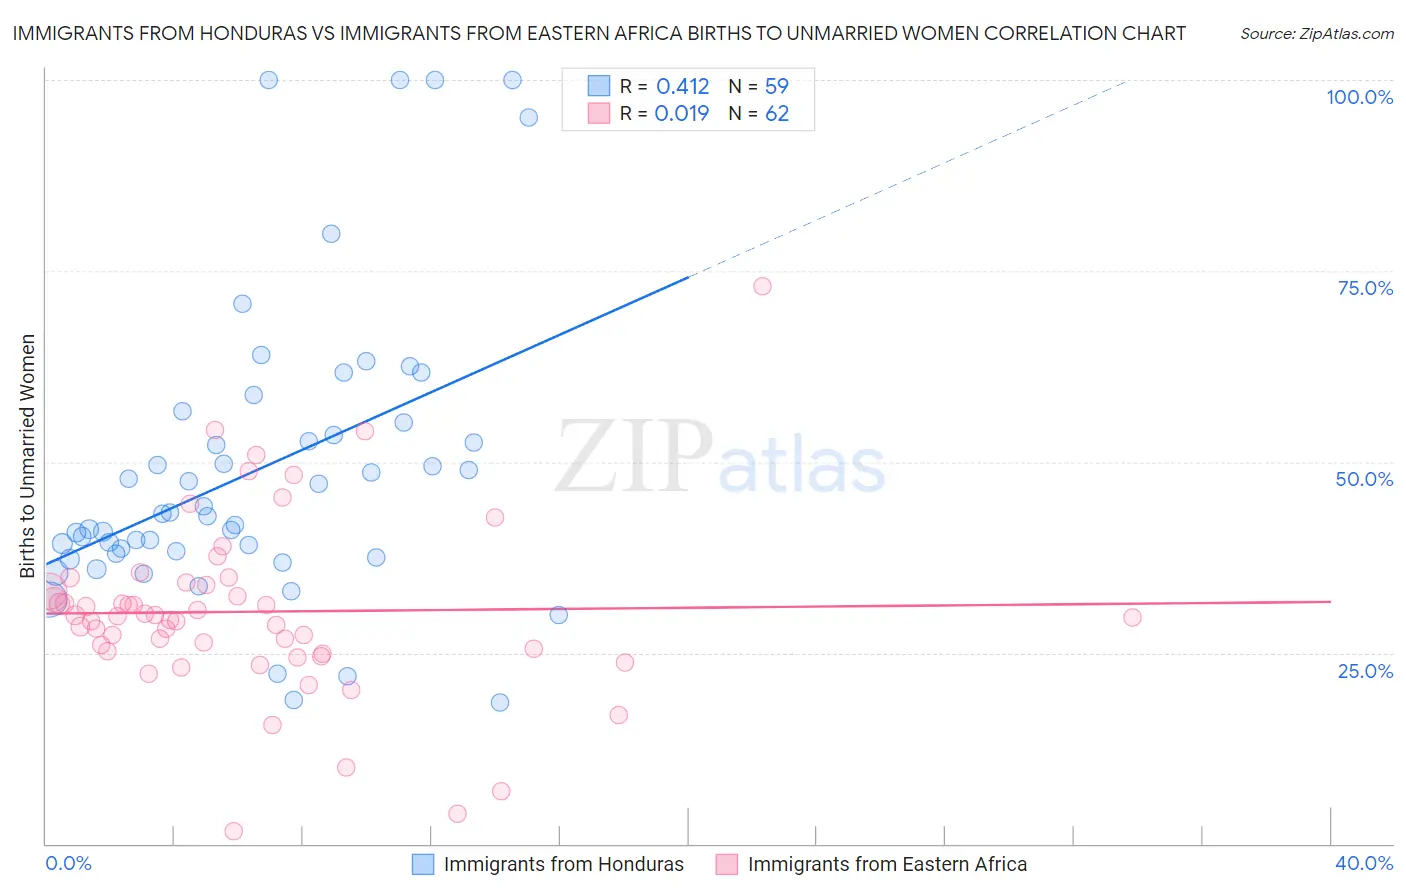
Immigrants from Honduras vs Immigrants from Eastern Africa Births to Unmarried Women Correlation Chart
The statistical analysis conducted on geographies consisting of 311,068,585 people shows a moderate positive correlation between the proportion of Immigrants from Honduras and percentage of births to unmarried women in the United States with a correlation coefficient (R) of 0.412 and weighted average of 39.3%. Similarly, the statistical analysis conducted on geographies consisting of 336,393,079 people shows no correlation between the proportion of Immigrants from Eastern Africa and percentage of births to unmarried women in the United States with a correlation coefficient (R) of 0.019 and weighted average of 31.0%, a difference of 27.0%.
Births to Unmarried Women Correlation Summary
| Measurement | Immigrants from Honduras | Immigrants from Eastern Africa |
| Minimum | 18.5% | 1.6% |
| Maximum | 100.0% | 73.0% |
| Range | 81.5% | 71.4% |
| Mean | 49.0% | 30.4% |
| Median | 43.2% | 29.8% |
| Interquartile 25% (IQ1) | 38.0% | 25.2% |
| Interquartile 75% (IQ3) | 55.1% | 33.8% |
| Interquartile Range (IQR) | 17.1% | 8.6% |
| Standard Deviation (Sample) | 19.4% | 11.7% |
| Standard Deviation (Population) | 19.2% | 11.6% |
Similar Demographics by Births to Unmarried Women
Demographics Similar to Immigrants from Honduras by Births to Unmarried Women
In terms of births to unmarried women, the demographic groups most similar to Immigrants from Honduras are Aleut (39.3%, a difference of 0.090%), Cuban (39.4%, a difference of 0.21%), Immigrants from Dominica (39.5%, a difference of 0.43%), Immigrants from the Azores (39.6%, a difference of 0.67%), and U.S. Virgin Islander (39.6%, a difference of 0.69%).
| Demographics | Rating | Rank | Births to Unmarried Women |
| Immigrants | West Indies | 0.0 /100 | #300 | Tragic 38.6% |
| Haitians | 0.0 /100 | #301 | Tragic 38.6% |
| Hondurans | 0.0 /100 | #302 | Tragic 38.7% |
| Immigrants | Jamaica | 0.0 /100 | #303 | Tragic 38.8% |
| Yaqui | 0.0 /100 | #304 | Tragic 38.8% |
| Immigrants | Haiti | 0.0 /100 | #305 | Tragic 38.9% |
| Central American Indians | 0.0 /100 | #306 | Tragic 39.0% |
| Immigrants | Honduras | 0.0 /100 | #307 | Tragic 39.3% |
| Aleuts | 0.0 /100 | #308 | Tragic 39.3% |
| Cubans | 0.0 /100 | #309 | Tragic 39.4% |
| Immigrants | Dominica | 0.0 /100 | #310 | Tragic 39.5% |
| Immigrants | Azores | 0.0 /100 | #311 | Tragic 39.6% |
| U.S. Virgin Islanders | 0.0 /100 | #312 | Tragic 39.6% |
| Africans | 0.0 /100 | #313 | Tragic 39.7% |
| Immigrants | Caribbean | 0.0 /100 | #314 | Tragic 39.8% |
Demographics Similar to Immigrants from Eastern Africa by Births to Unmarried Women
In terms of births to unmarried women, the demographic groups most similar to Immigrants from Eastern Africa are Carpatho Rusyn (30.9%, a difference of 0.17%), Immigrants from Bangladesh (30.9%, a difference of 0.22%), Austrian (31.0%, a difference of 0.27%), Immigrants from England (31.1%, a difference of 0.32%), and Immigrants from Western Europe (31.1%, a difference of 0.33%).
| Demographics | Rating | Rank | Births to Unmarried Women |
| Somalis | 77.8 /100 | #150 | Good 30.7% |
| Italians | 77.0 /100 | #151 | Good 30.8% |
| Poles | 76.2 /100 | #152 | Good 30.8% |
| British | 76.0 /100 | #153 | Good 30.8% |
| Yugoslavians | 75.1 /100 | #154 | Good 30.8% |
| Immigrants | Bangladesh | 73.9 /100 | #155 | Good 30.9% |
| Carpatho Rusyns | 73.5 /100 | #156 | Good 30.9% |
| Immigrants | Eastern Africa | 72.1 /100 | #157 | Good 31.0% |
| Austrians | 69.9 /100 | #158 | Good 31.0% |
| Immigrants | England | 69.4 /100 | #159 | Good 31.1% |
| Immigrants | Western Europe | 69.3 /100 | #160 | Good 31.1% |
| Immigrants | Southern Europe | 68.7 /100 | #161 | Good 31.1% |
| Slovenes | 65.9 /100 | #162 | Good 31.2% |
| Immigrants | Chile | 65.7 /100 | #163 | Good 31.2% |
| Hungarians | 64.1 /100 | #164 | Good 31.2% |