Immigrants from Honduras vs Macedonian Seniors Poverty Over the Age of 75
COMPARE
Immigrants from Honduras
Macedonian
Seniors Poverty Over the Age of 75
Seniors Poverty Over the Age of 75 Comparison
Immigrants from Honduras
Macedonians
15.7%
SENIORS POVERTY OVER THE AGE OF 75
0.0/ 100
METRIC RATING
303rd/ 347
METRIC RANK
11.4%
SENIORS POVERTY OVER THE AGE OF 75
95.5/ 100
METRIC RATING
78th/ 347
METRIC RANK
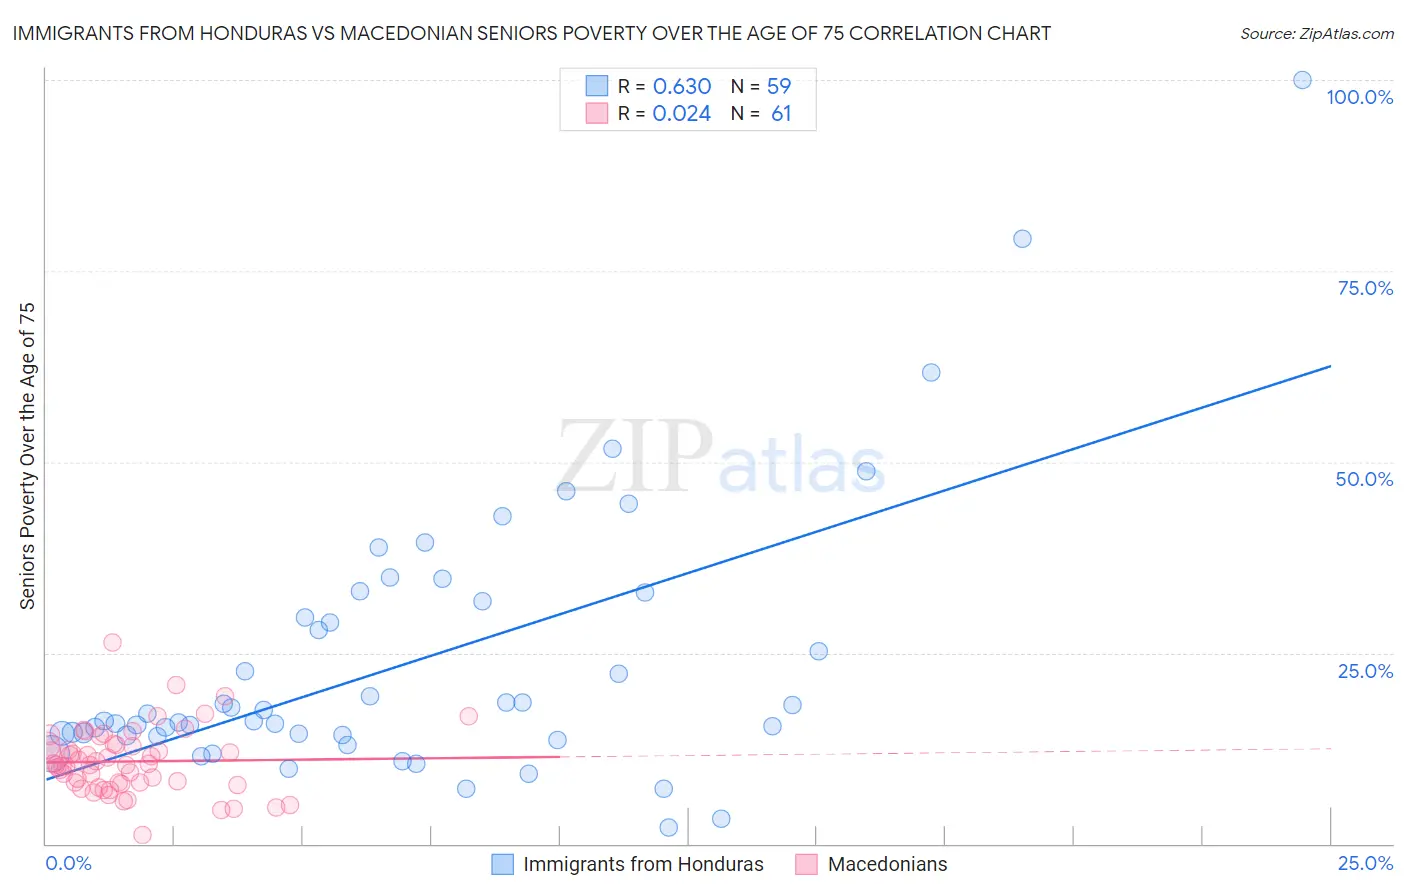
Immigrants from Honduras vs Macedonian Seniors Poverty Over the Age of 75 Correlation Chart
The statistical analysis conducted on geographies consisting of 320,172,645 people shows a significant positive correlation between the proportion of Immigrants from Honduras and poverty level among seniors over the age of 75 in the United States with a correlation coefficient (R) of 0.630 and weighted average of 15.7%. Similarly, the statistical analysis conducted on geographies consisting of 132,167,678 people shows no correlation between the proportion of Macedonians and poverty level among seniors over the age of 75 in the United States with a correlation coefficient (R) of 0.024 and weighted average of 11.4%, a difference of 37.4%.
Seniors Poverty Over the Age of 75 Correlation Summary
| Measurement | Immigrants from Honduras | Macedonian |
| Minimum | 2.1% | 1.2% |
| Maximum | 100.0% | 26.4% |
| Range | 97.9% | 25.2% |
| Mean | 23.7% | 10.8% |
| Median | 16.1% | 10.3% |
| Interquartile 25% (IQ1) | 14.2% | 7.9% |
| Interquartile 75% (IQ3) | 31.8% | 12.9% |
| Interquartile Range (IQR) | 17.6% | 5.0% |
| Standard Deviation (Sample) | 17.8% | 4.3% |
| Standard Deviation (Population) | 17.7% | 4.3% |
Similar Demographics by Seniors Poverty Over the Age of 75
Demographics Similar to Immigrants from Honduras by Seniors Poverty Over the Age of 75
In terms of seniors poverty over the age of 75, the demographic groups most similar to Immigrants from Honduras are West Indian (15.7%, a difference of 0.17%), Immigrants from Trinidad and Tobago (15.7%, a difference of 0.18%), Ecuadorian (15.7%, a difference of 0.22%), Hispanic or Latino (15.8%, a difference of 0.38%), and Immigrants from Latin America (15.6%, a difference of 0.48%).
| Demographics | Rating | Rank | Seniors Poverty Over the Age of 75 |
| Yuman | 0.0 /100 | #296 | Tragic 15.4% |
| Hondurans | 0.0 /100 | #297 | Tragic 15.4% |
| Natives/Alaskans | 0.0 /100 | #298 | Tragic 15.5% |
| Spanish American Indians | 0.0 /100 | #299 | Tragic 15.5% |
| Bahamians | 0.0 /100 | #300 | Tragic 15.5% |
| Immigrants | Latin America | 0.0 /100 | #301 | Tragic 15.6% |
| West Indians | 0.0 /100 | #302 | Tragic 15.7% |
| Immigrants | Honduras | 0.0 /100 | #303 | Tragic 15.7% |
| Immigrants | Trinidad and Tobago | 0.0 /100 | #304 | Tragic 15.7% |
| Ecuadorians | 0.0 /100 | #305 | Tragic 15.7% |
| Hispanics or Latinos | 0.0 /100 | #306 | Tragic 15.8% |
| Immigrants | West Indies | 0.0 /100 | #307 | Tragic 15.8% |
| Immigrants | Bangladesh | 0.0 /100 | #308 | Tragic 15.8% |
| Yup'ik | 0.0 /100 | #309 | Tragic 15.8% |
| Vietnamese | 0.0 /100 | #310 | Tragic 15.9% |
Demographics Similar to Macedonians by Seniors Poverty Over the Age of 75
In terms of seniors poverty over the age of 75, the demographic groups most similar to Macedonians are Filipino (11.4%, a difference of 0.0%), White/Caucasian (11.4%, a difference of 0.010%), Alaska Native (11.4%, a difference of 0.060%), French Canadian (11.4%, a difference of 0.090%), and Palestinian (11.4%, a difference of 0.16%).
| Demographics | Rating | Rank | Seniors Poverty Over the Age of 75 |
| Osage | 96.3 /100 | #71 | Exceptional 11.4% |
| Sierra Leoneans | 96.1 /100 | #72 | Exceptional 11.4% |
| Immigrants | Micronesia | 96.0 /100 | #73 | Exceptional 11.4% |
| Delaware | 96.0 /100 | #74 | Exceptional 11.4% |
| Palestinians | 95.8 /100 | #75 | Exceptional 11.4% |
| French Canadians | 95.7 /100 | #76 | Exceptional 11.4% |
| Whites/Caucasians | 95.5 /100 | #77 | Exceptional 11.4% |
| Macedonians | 95.5 /100 | #78 | Exceptional 11.4% |
| Filipinos | 95.5 /100 | #79 | Exceptional 11.4% |
| Alaska Natives | 95.4 /100 | #80 | Exceptional 11.4% |
| Basques | 95.1 /100 | #81 | Exceptional 11.5% |
| Iranians | 95.1 /100 | #82 | Exceptional 11.5% |
| Immigrants | South Africa | 94.9 /100 | #83 | Exceptional 11.5% |
| Immigrants | Iraq | 94.9 /100 | #84 | Exceptional 11.5% |
| Immigrants | Bulgaria | 94.7 /100 | #85 | Exceptional 11.5% |