Immigrants from Haiti vs Paraguayan Family Households
COMPARE
Immigrants from Haiti
Paraguayan
Family Households
Family Households Comparison
Immigrants from Haiti
Paraguayans
65.3%
FAMILY HOUSEHOLDS
99.1/ 100
METRIC RATING
88th/ 347
METRIC RANK
64.1%
FAMILY HOUSEHOLDS
26.7/ 100
METRIC RATING
188th/ 347
METRIC RANK
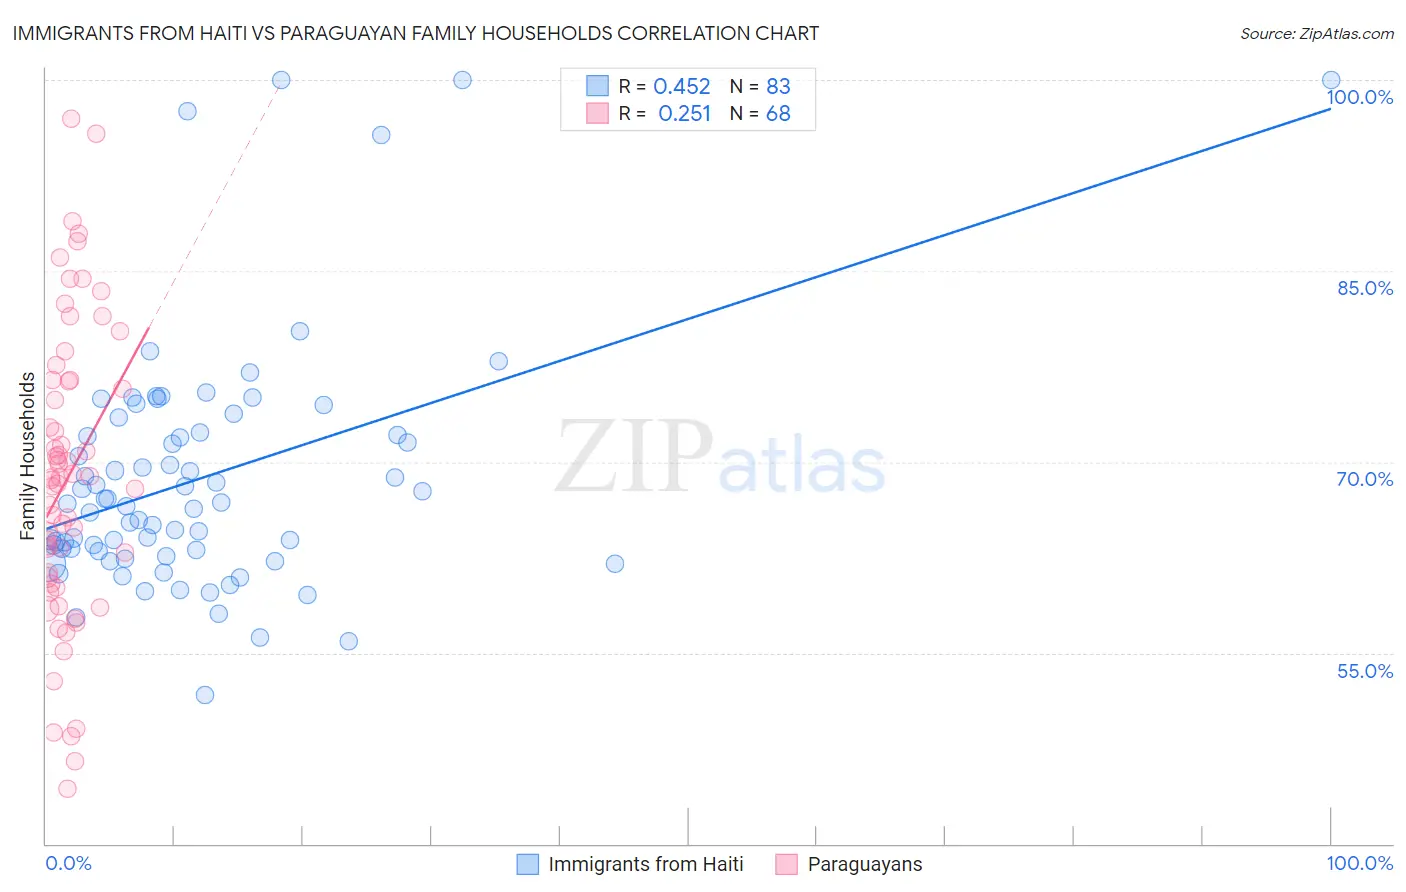
Immigrants from Haiti vs Paraguayan Family Households Correlation Chart
The statistical analysis conducted on geographies consisting of 225,175,344 people shows a moderate positive correlation between the proportion of Immigrants from Haiti and percentage of family households in the United States with a correlation coefficient (R) of 0.452 and weighted average of 65.3%. Similarly, the statistical analysis conducted on geographies consisting of 95,096,913 people shows a weak positive correlation between the proportion of Paraguayans and percentage of family households in the United States with a correlation coefficient (R) of 0.251 and weighted average of 64.1%, a difference of 1.9%.
Family Households Correlation Summary
| Measurement | Immigrants from Haiti | Paraguayan |
| Minimum | 51.7% | 44.3% |
| Maximum | 100.0% | 96.9% |
| Range | 48.3% | 52.6% |
| Mean | 68.7% | 68.8% |
| Median | 66.8% | 68.7% |
| Interquartile 25% (IQ1) | 63.0% | 60.7% |
| Interquartile 75% (IQ3) | 72.3% | 76.4% |
| Interquartile Range (IQR) | 9.3% | 15.7% |
| Standard Deviation (Sample) | 9.6% | 11.5% |
| Standard Deviation (Population) | 9.5% | 11.5% |
Similar Demographics by Family Households
Demographics Similar to Immigrants from Haiti by Family Households
In terms of family households, the demographic groups most similar to Immigrants from Haiti are Immigrants from Caribbean (65.3%, a difference of 0.010%), Immigrants from Laos (65.3%, a difference of 0.020%), Immigrants from Egypt (65.3%, a difference of 0.030%), Crow (65.3%, a difference of 0.070%), and Hopi (65.3%, a difference of 0.11%).
| Demographics | Rating | Rank | Family Households |
| Jordanians | 99.7 /100 | #81 | Exceptional 65.5% |
| Immigrants | Lebanon | 99.7 /100 | #82 | Exceptional 65.5% |
| Immigrants | Guyana | 99.6 /100 | #83 | Exceptional 65.5% |
| Americans | 99.6 /100 | #84 | Exceptional 65.5% |
| Immigrants | Cambodia | 99.5 /100 | #85 | Exceptional 65.4% |
| Egyptians | 99.4 /100 | #86 | Exceptional 65.4% |
| Immigrants | Egypt | 99.2 /100 | #87 | Exceptional 65.3% |
| Immigrants | Haiti | 99.1 /100 | #88 | Exceptional 65.3% |
| Immigrants | Caribbean | 99.1 /100 | #89 | Exceptional 65.3% |
| Immigrants | Laos | 99.1 /100 | #90 | Exceptional 65.3% |
| Crow | 98.9 /100 | #91 | Exceptional 65.3% |
| Hopi | 98.8 /100 | #92 | Exceptional 65.3% |
| Guyanese | 98.8 /100 | #93 | Exceptional 65.3% |
| Immigrants | Poland | 98.7 /100 | #94 | Exceptional 65.2% |
| Immigrants | Portugal | 98.6 /100 | #95 | Exceptional 65.2% |
Demographics Similar to Paraguayans by Family Households
In terms of family households, the demographic groups most similar to Paraguayans are Immigrants from Western Asia (64.1%, a difference of 0.020%), Northern European (64.1%, a difference of 0.030%), Zimbabwean (64.1%, a difference of 0.040%), Arab (64.1%, a difference of 0.040%), and Lithuanian (64.0%, a difference of 0.050%).
| Demographics | Rating | Rank | Family Households |
| Immigrants | Trinidad and Tobago | 34.9 /100 | #181 | Fair 64.2% |
| Ukrainians | 34.6 /100 | #182 | Fair 64.2% |
| Creek | 34.1 /100 | #183 | Fair 64.2% |
| Puerto Ricans | 33.4 /100 | #184 | Fair 64.2% |
| Immigrants | Iran | 30.4 /100 | #185 | Fair 64.1% |
| Spanish Americans | 30.1 /100 | #186 | Fair 64.1% |
| Northern Europeans | 28.2 /100 | #187 | Fair 64.1% |
| Paraguayans | 26.7 /100 | #188 | Fair 64.1% |
| Immigrants | Western Asia | 25.3 /100 | #189 | Fair 64.1% |
| Zimbabweans | 24.7 /100 | #190 | Fair 64.1% |
| Arabs | 24.5 /100 | #191 | Fair 64.1% |
| Lithuanians | 23.8 /100 | #192 | Fair 64.0% |
| French | 23.7 /100 | #193 | Fair 64.0% |
| Paiute | 22.2 /100 | #194 | Fair 64.0% |
| Immigrants | North America | 20.0 /100 | #195 | Poor 64.0% |