French Canadian vs Immigrants from Italy Married-couple Households
COMPARE
French Canadian
Immigrants from Italy
Married-couple Households
Married-couple Households Comparison
French Canadians
Immigrants from Italy
47.5%
MARRIED-COUPLE HOUSEHOLDS
92.4/ 100
METRIC RATING
117th/ 347
METRIC RANK
47.9%
MARRIED-COUPLE HOUSEHOLDS
96.3/ 100
METRIC RATING
100th/ 347
METRIC RANK
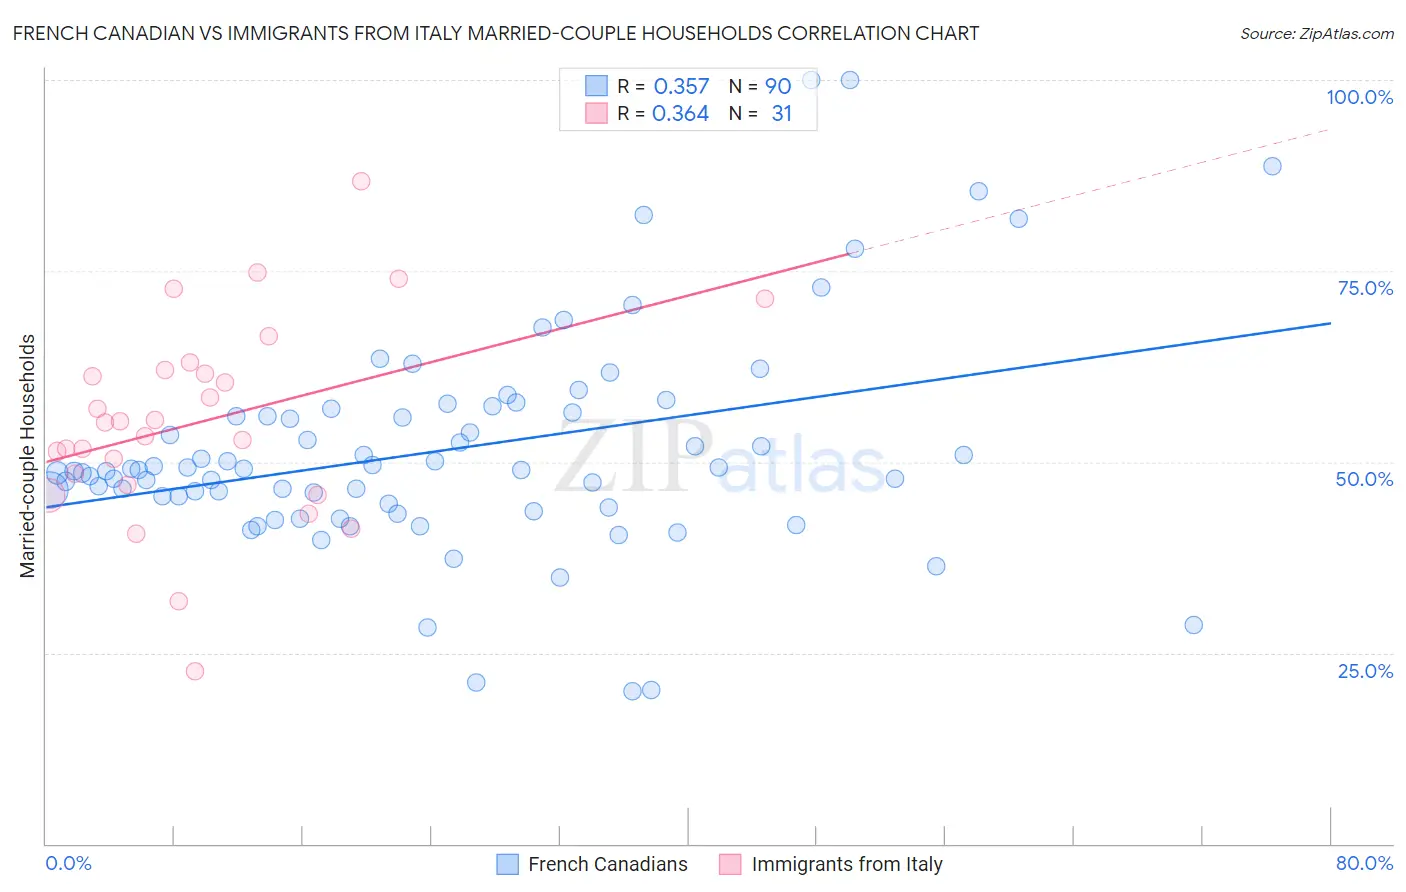
French Canadian vs Immigrants from Italy Married-couple Households Correlation Chart
The statistical analysis conducted on geographies consisting of 502,245,459 people shows a mild positive correlation between the proportion of French Canadians and percentage of married-couple family households in the United States with a correlation coefficient (R) of 0.357 and weighted average of 47.5%. Similarly, the statistical analysis conducted on geographies consisting of 324,146,965 people shows a mild positive correlation between the proportion of Immigrants from Italy and percentage of married-couple family households in the United States with a correlation coefficient (R) of 0.364 and weighted average of 47.9%, a difference of 0.71%.
Married-couple Households Correlation Summary
| Measurement | French Canadian | Immigrants from Italy |
| Minimum | 19.9% | 22.5% |
| Maximum | 100.0% | 86.8% |
| Range | 80.1% | 64.2% |
| Mean | 51.6% | 55.3% |
| Median | 48.9% | 55.1% |
| Interquartile 25% (IQ1) | 44.5% | 47.0% |
| Interquartile 75% (IQ3) | 56.5% | 62.1% |
| Interquartile Range (IQR) | 12.0% | 15.1% |
| Standard Deviation (Sample) | 14.4% | 13.2% |
| Standard Deviation (Population) | 14.4% | 12.9% |
Demographics Similar to French Canadians and Immigrants from Italy by Married-couple Households
In terms of married-couple households, the demographic groups most similar to French Canadians are Argentinean (47.5%, a difference of 0.010%), Immigrants from Germany (47.5%, a difference of 0.010%), Slovak (47.6%, a difference of 0.060%), Immigrants from Europe (47.6%, a difference of 0.18%), and Venezuelan (47.6%, a difference of 0.19%). Similarly, the demographic groups most similar to Immigrants from Italy are Immigrants from Austria (47.9%, a difference of 0.010%), Immigrants from North Macedonia (47.9%, a difference of 0.020%), Turkish (47.8%, a difference of 0.060%), Slavic (47.8%, a difference of 0.080%), and Hawaiian (47.8%, a difference of 0.080%).
| Demographics | Rating | Rank | Married-couple Households |
| Immigrants | North Macedonia | 96.4 /100 | #98 | Exceptional 47.9% |
| Immigrants | Austria | 96.4 /100 | #99 | Exceptional 47.9% |
| Immigrants | Italy | 96.3 /100 | #100 | Exceptional 47.9% |
| Turks | 96.1 /100 | #101 | Exceptional 47.8% |
| Slavs | 96.0 /100 | #102 | Exceptional 47.8% |
| Hawaiians | 96.0 /100 | #103 | Exceptional 47.8% |
| Immigrants | South Africa | 96.0 /100 | #104 | Exceptional 47.8% |
| Immigrants | Czechoslovakia | 95.5 /100 | #105 | Exceptional 47.8% |
| Portuguese | 95.5 /100 | #106 | Exceptional 47.8% |
| Estonians | 94.7 /100 | #107 | Exceptional 47.7% |
| Immigrants | Japan | 94.4 /100 | #108 | Exceptional 47.7% |
| Immigrants | Jordan | 94.1 /100 | #109 | Exceptional 47.7% |
| Macedonians | 93.9 /100 | #110 | Exceptional 47.6% |
| Syrians | 93.9 /100 | #111 | Exceptional 47.6% |
| Peruvians | 93.8 /100 | #112 | Exceptional 47.6% |
| Venezuelans | 93.8 /100 | #113 | Exceptional 47.6% |
| Immigrants | Europe | 93.7 /100 | #114 | Exceptional 47.6% |
| Slovaks | 92.9 /100 | #115 | Exceptional 47.6% |
| Argentineans | 92.5 /100 | #116 | Exceptional 47.5% |
| French Canadians | 92.4 /100 | #117 | Exceptional 47.5% |
| Immigrants | Germany | 92.4 /100 | #118 | Exceptional 47.5% |