Immigrants from Germany vs Immigrants from Ukraine Family Households
COMPARE
Immigrants from Germany
Immigrants from Ukraine
Family Households
Family Households Comparison
Immigrants from Germany
Immigrants from Ukraine
64.3%
FAMILY HOUSEHOLDS
50.0/ 100
METRIC RATING
174th/ 347
METRIC RANK
64.2%
FAMILY HOUSEHOLDS
38.2/ 100
METRIC RATING
179th/ 347
METRIC RANK
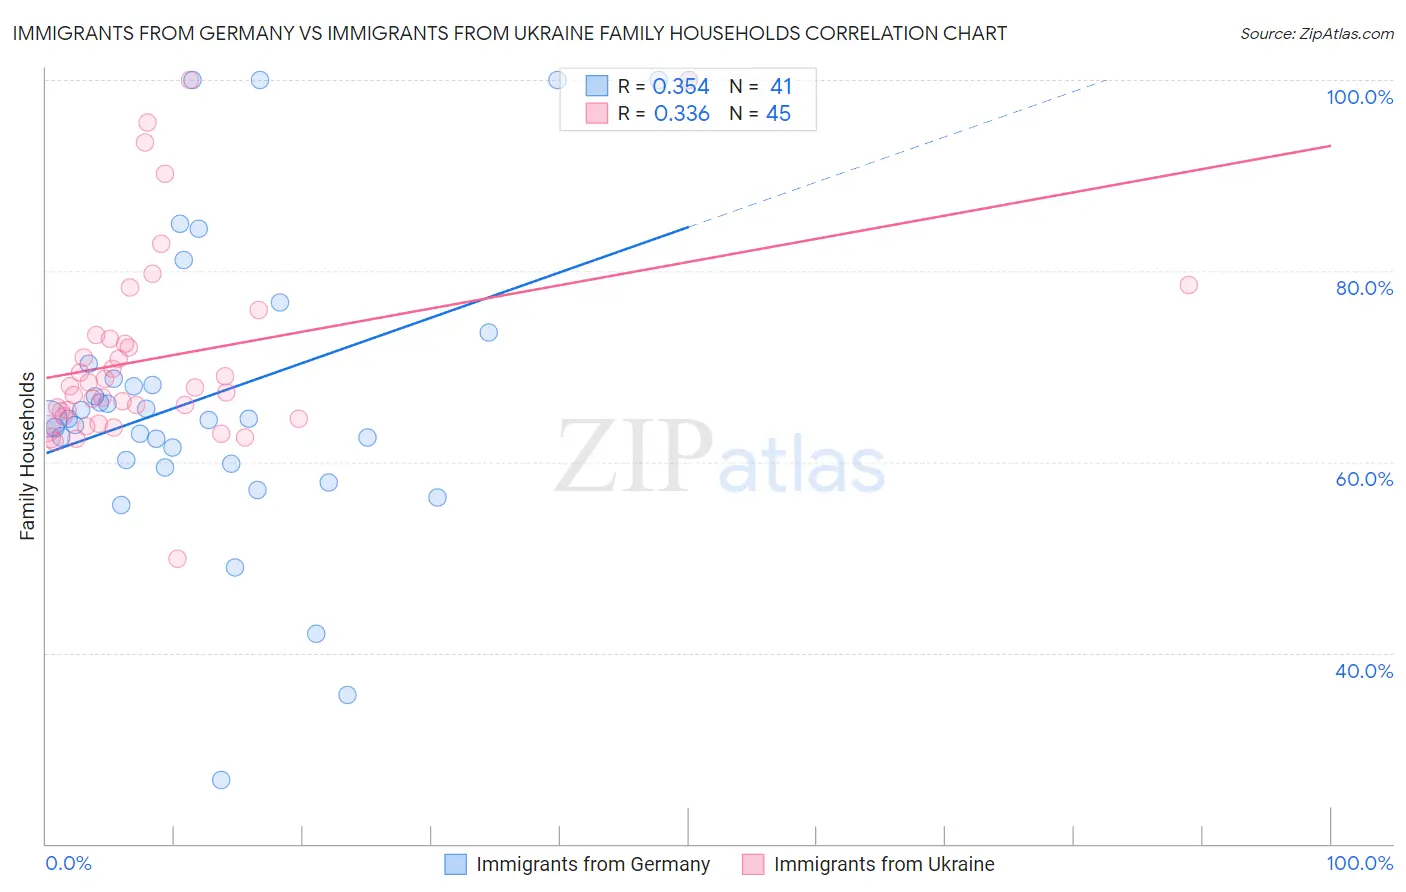
Immigrants from Germany vs Immigrants from Ukraine Family Households Correlation Chart
The statistical analysis conducted on geographies consisting of 463,759,917 people shows a mild positive correlation between the proportion of Immigrants from Germany and percentage of family households in the United States with a correlation coefficient (R) of 0.354 and weighted average of 64.3%. Similarly, the statistical analysis conducted on geographies consisting of 289,649,929 people shows a mild positive correlation between the proportion of Immigrants from Ukraine and percentage of family households in the United States with a correlation coefficient (R) of 0.336 and weighted average of 64.2%, a difference of 0.16%.
Family Households Correlation Summary
| Measurement | Immigrants from Germany | Immigrants from Ukraine |
| Minimum | 26.7% | 49.9% |
| Maximum | 100.0% | 100.0% |
| Range | 73.3% | 50.1% |
| Mean | 67.4% | 71.0% |
| Median | 64.5% | 67.7% |
| Interquartile 25% (IQ1) | 60.0% | 64.6% |
| Interquartile 75% (IQ3) | 71.9% | 73.1% |
| Interquartile Range (IQR) | 11.9% | 8.5% |
| Standard Deviation (Sample) | 16.4% | 10.5% |
| Standard Deviation (Population) | 16.2% | 10.4% |
Demographics Similar to Immigrants from Germany and Immigrants from Ukraine by Family Households
In terms of family households, the demographic groups most similar to Immigrants from Germany are Immigrants from Sierra Leone (64.3%, a difference of 0.030%), Dutch West Indian (64.3%, a difference of 0.050%), Ute (64.3%, a difference of 0.060%), Iraqi (64.4%, a difference of 0.080%), and Armenian (64.4%, a difference of 0.080%). Similarly, the demographic groups most similar to Immigrants from Ukraine are Jamaican (64.2%, a difference of 0.030%), Immigrants from Honduras (64.2%, a difference of 0.050%), Immigrants from Trinidad and Tobago (64.2%, a difference of 0.050%), Ukrainian (64.2%, a difference of 0.050%), and Immigrants from Micronesia (64.2%, a difference of 0.060%).
| Demographics | Rating | Rank | Family Households |
| Scotch-Irish | 59.2 /100 | #166 | Average 64.4% |
| Irish | 57.9 /100 | #167 | Average 64.4% |
| Hondurans | 57.5 /100 | #168 | Average 64.4% |
| Iraqis | 56.0 /100 | #169 | Average 64.4% |
| Armenians | 55.9 /100 | #170 | Average 64.4% |
| Ute | 54.6 /100 | #171 | Average 64.3% |
| Dutch West Indians | 53.9 /100 | #172 | Average 64.3% |
| Immigrants | Sierra Leone | 52.5 /100 | #173 | Average 64.3% |
| Immigrants | Germany | 50.0 /100 | #174 | Average 64.3% |
| Bangladeshis | 44.3 /100 | #175 | Average 64.3% |
| Vietnamese | 43.6 /100 | #176 | Average 64.2% |
| Immigrants | Micronesia | 42.3 /100 | #177 | Average 64.2% |
| Jamaicans | 40.6 /100 | #178 | Average 64.2% |
| Immigrants | Ukraine | 38.2 /100 | #179 | Fair 64.2% |
| Immigrants | Honduras | 35.0 /100 | #180 | Fair 64.2% |
| Immigrants | Trinidad and Tobago | 34.9 /100 | #181 | Fair 64.2% |
| Ukrainians | 34.6 /100 | #182 | Fair 64.2% |
| Creek | 34.1 /100 | #183 | Fair 64.2% |
| Puerto Ricans | 33.4 /100 | #184 | Fair 64.2% |
| Immigrants | Iran | 30.4 /100 | #185 | Fair 64.1% |
| Spanish Americans | 30.1 /100 | #186 | Fair 64.1% |