Immigrants from Armenia vs Yuman Family Households
COMPARE
Immigrants from Armenia
Yuman
Family Households
Family Households Comparison
Immigrants from Armenia
Yuman
63.5%
FAMILY HOUSEHOLDS
2.6/ 100
METRIC RATING
233rd/ 347
METRIC RANK
69.3%
FAMILY HOUSEHOLDS
100.0/ 100
METRIC RATING
5th/ 347
METRIC RANK
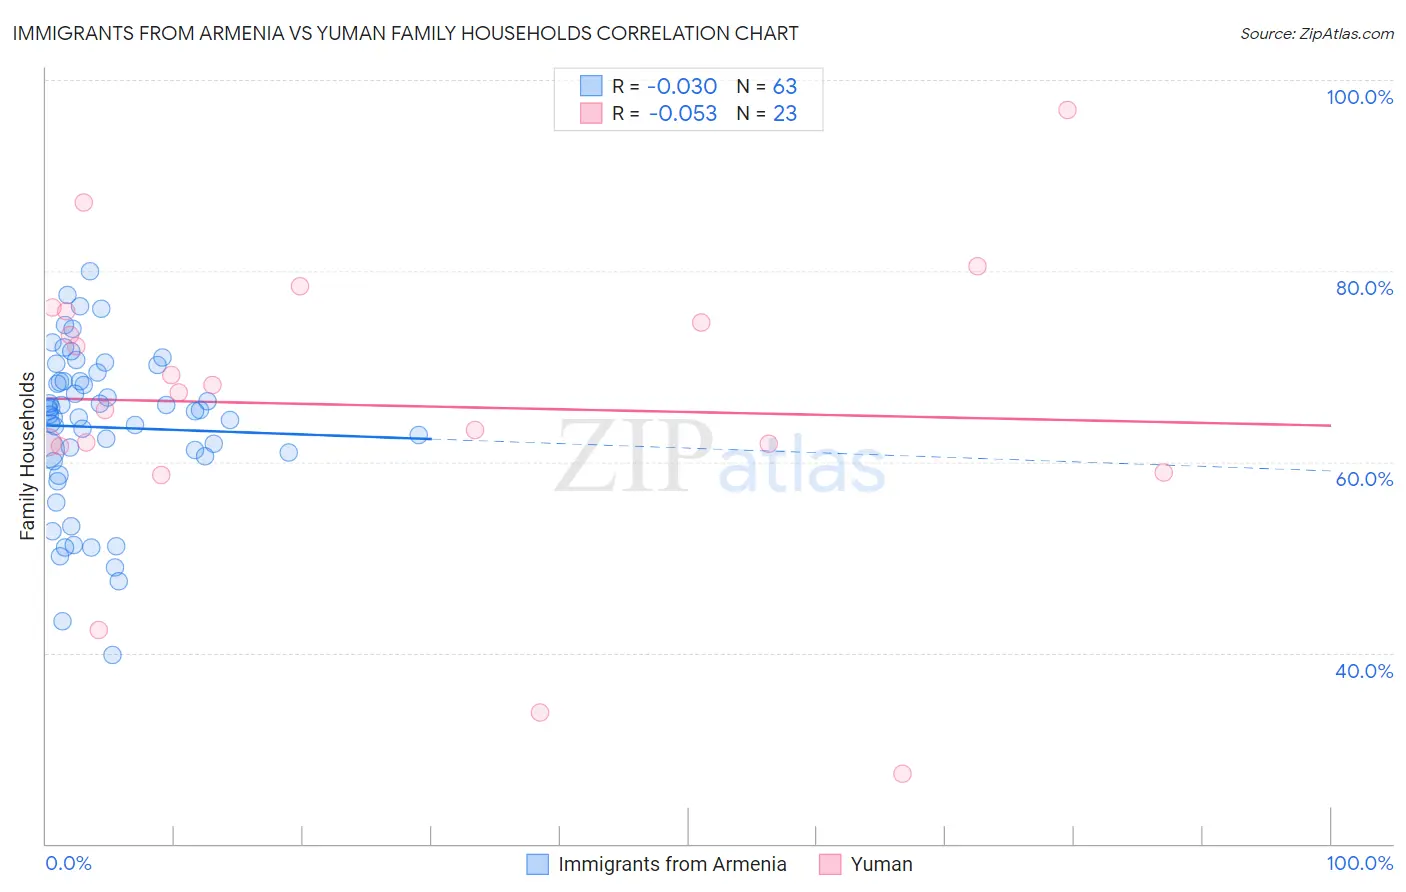
Immigrants from Armenia vs Yuman Family Households Correlation Chart
The statistical analysis conducted on geographies consisting of 97,683,198 people shows no correlation between the proportion of Immigrants from Armenia and percentage of family households in the United States with a correlation coefficient (R) of -0.030 and weighted average of 63.5%. Similarly, the statistical analysis conducted on geographies consisting of 40,663,643 people shows a slight negative correlation between the proportion of Yuman and percentage of family households in the United States with a correlation coefficient (R) of -0.053 and weighted average of 69.3%, a difference of 9.1%.
Family Households Correlation Summary
| Measurement | Immigrants from Armenia | Yuman |
| Minimum | 39.7% | 27.3% |
| Maximum | 79.9% | 96.9% |
| Range | 40.2% | 69.6% |
| Mean | 63.6% | 65.9% |
| Median | 65.3% | 67.2% |
| Interquartile 25% (IQ1) | 60.6% | 61.6% |
| Interquartile 75% (IQ3) | 68.5% | 75.7% |
| Interquartile Range (IQR) | 7.9% | 14.1% |
| Standard Deviation (Sample) | 8.3% | 15.7% |
| Standard Deviation (Population) | 8.3% | 15.4% |
Similar Demographics by Family Households
Demographics Similar to Immigrants from Armenia by Family Households
In terms of family households, the demographic groups most similar to Immigrants from Armenia are Immigrants from Northern Africa (63.5%, a difference of 0.010%), Finnish (63.5%, a difference of 0.030%), Immigrants from Greece (63.5%, a difference of 0.050%), Albanian (63.5%, a difference of 0.050%), and Immigrants from Brazil (63.6%, a difference of 0.060%).
| Demographics | Rating | Rank | Family Households |
| Immigrants | Bahamas | 4.2 /100 | #226 | Tragic 63.6% |
| Trinidadians and Tobagonians | 4.1 /100 | #227 | Tragic 63.6% |
| Blackfeet | 3.6 /100 | #228 | Tragic 63.6% |
| Bulgarians | 3.4 /100 | #229 | Tragic 63.6% |
| Immigrants | Brazil | 3.0 /100 | #230 | Tragic 63.6% |
| Immigrants | Greece | 2.9 /100 | #231 | Tragic 63.5% |
| Immigrants | Northern Africa | 2.6 /100 | #232 | Tragic 63.5% |
| Immigrants | Armenia | 2.6 /100 | #233 | Tragic 63.5% |
| Finns | 2.3 /100 | #234 | Tragic 63.5% |
| Albanians | 2.2 /100 | #235 | Tragic 63.5% |
| Ghanaians | 2.1 /100 | #236 | Tragic 63.5% |
| Comanche | 2.1 /100 | #237 | Tragic 63.5% |
| Immigrants | Zimbabwe | 2.0 /100 | #238 | Tragic 63.5% |
| Aleuts | 1.9 /100 | #239 | Tragic 63.4% |
| South Africans | 1.9 /100 | #240 | Tragic 63.4% |
Demographics Similar to Yuman by Family Households
In terms of family households, the demographic groups most similar to Yuman are Yakama (69.3%, a difference of 0.030%), Immigrants from Mexico (69.1%, a difference of 0.24%), Mexican (69.0%, a difference of 0.45%), Tongan (69.6%, a difference of 0.47%), and Immigrants from Fiji (68.8%, a difference of 0.77%).
| Demographics | Rating | Rank | Family Households |
| Yup'ik | 100 /100 | #1 | Exceptional 72.4% |
| Spanish American Indians | 100.0 /100 | #2 | Exceptional 71.2% |
| Tongans | 100.0 /100 | #3 | Exceptional 69.6% |
| Yakama | 100.0 /100 | #4 | Exceptional 69.3% |
| Yuman | 100.0 /100 | #5 | Exceptional 69.3% |
| Immigrants | Mexico | 100.0 /100 | #6 | Exceptional 69.1% |
| Mexicans | 100.0 /100 | #7 | Exceptional 69.0% |
| Immigrants | Fiji | 100.0 /100 | #8 | Exceptional 68.8% |
| Native Hawaiians | 100.0 /100 | #9 | Exceptional 68.4% |
| Immigrants | Philippines | 100.0 /100 | #10 | Exceptional 68.3% |
| Immigrants | Central America | 100.0 /100 | #11 | Exceptional 68.3% |
| Koreans | 100.0 /100 | #12 | Exceptional 68.3% |
| Pueblo | 100.0 /100 | #13 | Exceptional 68.2% |
| Immigrants | Cuba | 100.0 /100 | #14 | Exceptional 68.2% |
| Assyrians/Chaldeans/Syriacs | 100.0 /100 | #15 | Exceptional 68.2% |