Immigrants from Colombia vs Yuman Family Households
COMPARE
Immigrants from Colombia
Yuman
Family Households
Family Households Comparison
Immigrants from Colombia
Yuman
66.3%
FAMILY HOUSEHOLDS
100.0/ 100
METRIC RATING
54th/ 347
METRIC RANK
69.3%
FAMILY HOUSEHOLDS
100.0/ 100
METRIC RATING
5th/ 347
METRIC RANK
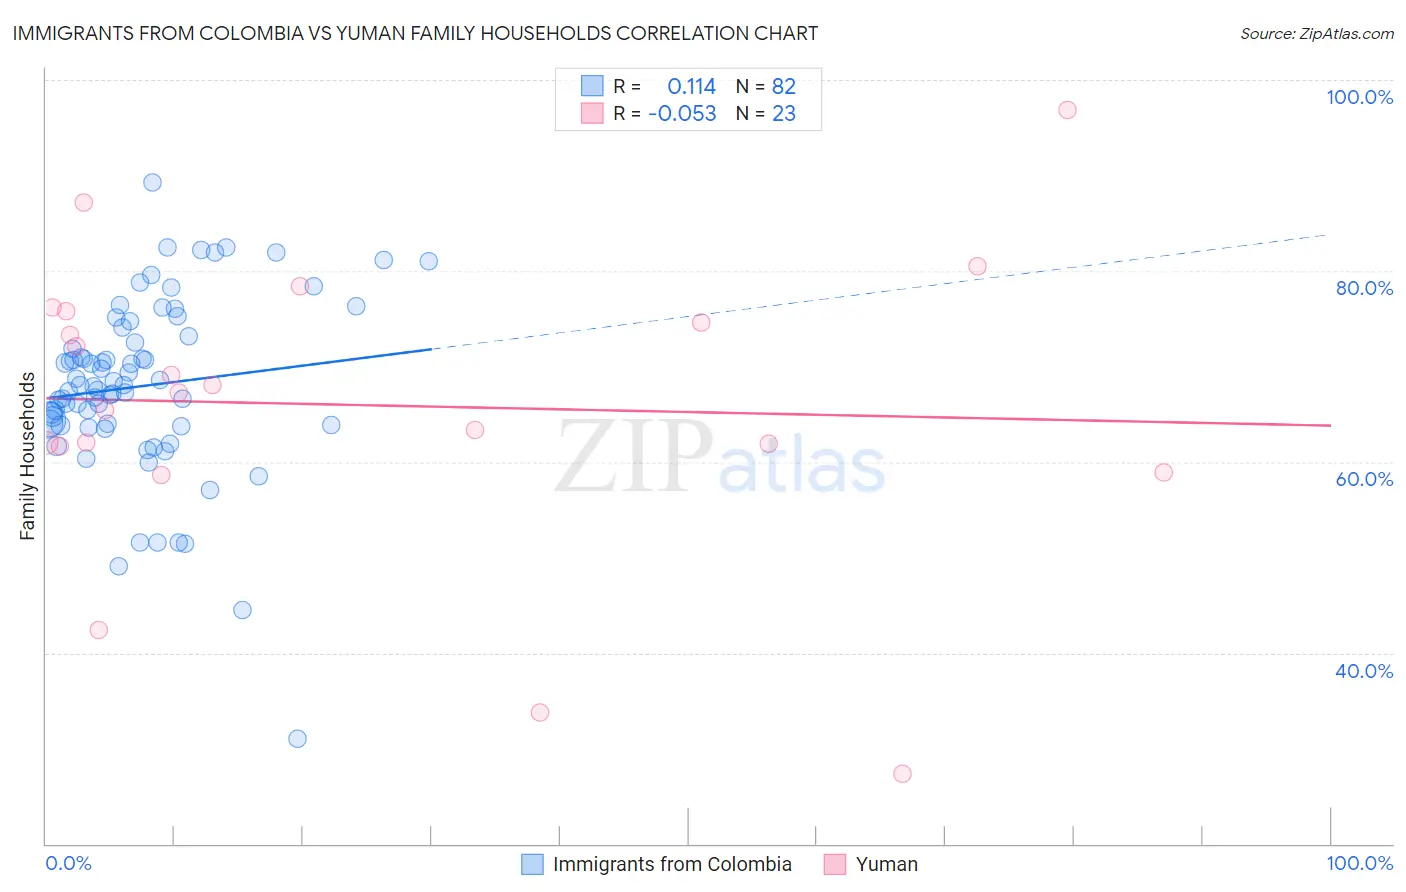
Immigrants from Colombia vs Yuman Family Households Correlation Chart
The statistical analysis conducted on geographies consisting of 378,535,388 people shows a poor positive correlation between the proportion of Immigrants from Colombia and percentage of family households in the United States with a correlation coefficient (R) of 0.114 and weighted average of 66.3%. Similarly, the statistical analysis conducted on geographies consisting of 40,663,643 people shows a slight negative correlation between the proportion of Yuman and percentage of family households in the United States with a correlation coefficient (R) of -0.053 and weighted average of 69.3%, a difference of 4.6%.
Family Households Correlation Summary
| Measurement | Immigrants from Colombia | Yuman |
| Minimum | 31.0% | 27.3% |
| Maximum | 89.3% | 96.9% |
| Range | 58.3% | 69.6% |
| Mean | 67.9% | 65.9% |
| Median | 68.0% | 67.2% |
| Interquartile 25% (IQ1) | 63.8% | 61.6% |
| Interquartile 75% (IQ3) | 73.2% | 75.7% |
| Interquartile Range (IQR) | 9.4% | 14.1% |
| Standard Deviation (Sample) | 9.3% | 15.7% |
| Standard Deviation (Population) | 9.2% | 15.4% |
Similar Demographics by Family Households
Demographics Similar to Immigrants from Colombia by Family Households
In terms of family households, the demographic groups most similar to Immigrants from Colombia are Afghan (66.3%, a difference of 0.0%), Colombian (66.3%, a difference of 0.010%), Native/Alaskan (66.4%, a difference of 0.14%), Navajo (66.4%, a difference of 0.17%), and Immigrants (66.1%, a difference of 0.17%).
| Demographics | Rating | Rank | Family Households |
| Bolivians | 100.0 /100 | #47 | Exceptional 66.5% |
| Immigrants | Venezuela | 100.0 /100 | #48 | Exceptional 66.4% |
| Immigrants | South Central Asia | 100.0 /100 | #49 | Exceptional 66.4% |
| Navajo | 100.0 /100 | #50 | Exceptional 66.4% |
| Natives/Alaskans | 100.0 /100 | #51 | Exceptional 66.4% |
| Colombians | 100.0 /100 | #52 | Exceptional 66.3% |
| Afghans | 100.0 /100 | #53 | Exceptional 66.3% |
| Immigrants | Colombia | 100.0 /100 | #54 | Exceptional 66.3% |
| Immigrants | Immigrants | 100.0 /100 | #55 | Exceptional 66.1% |
| Immigrants | Hong Kong | 100.0 /100 | #56 | Exceptional 66.1% |
| Pennsylvania Germans | 100.0 /100 | #57 | Exceptional 66.1% |
| Immigrants | Asia | 100.0 /100 | #58 | Exceptional 66.1% |
| Immigrants | Korea | 100.0 /100 | #59 | Exceptional 66.0% |
| South Americans | 100.0 /100 | #60 | Exceptional 66.0% |
| Danes | 100.0 /100 | #61 | Exceptional 66.0% |
Demographics Similar to Yuman by Family Households
In terms of family households, the demographic groups most similar to Yuman are Yakama (69.3%, a difference of 0.030%), Immigrants from Mexico (69.1%, a difference of 0.24%), Mexican (69.0%, a difference of 0.45%), Tongan (69.6%, a difference of 0.47%), and Immigrants from Fiji (68.8%, a difference of 0.77%).
| Demographics | Rating | Rank | Family Households |
| Yup'ik | 100 /100 | #1 | Exceptional 72.4% |
| Spanish American Indians | 100.0 /100 | #2 | Exceptional 71.2% |
| Tongans | 100.0 /100 | #3 | Exceptional 69.6% |
| Yakama | 100.0 /100 | #4 | Exceptional 69.3% |
| Yuman | 100.0 /100 | #5 | Exceptional 69.3% |
| Immigrants | Mexico | 100.0 /100 | #6 | Exceptional 69.1% |
| Mexicans | 100.0 /100 | #7 | Exceptional 69.0% |
| Immigrants | Fiji | 100.0 /100 | #8 | Exceptional 68.8% |
| Native Hawaiians | 100.0 /100 | #9 | Exceptional 68.4% |
| Immigrants | Philippines | 100.0 /100 | #10 | Exceptional 68.3% |
| Immigrants | Central America | 100.0 /100 | #11 | Exceptional 68.3% |
| Koreans | 100.0 /100 | #12 | Exceptional 68.3% |
| Pueblo | 100.0 /100 | #13 | Exceptional 68.2% |
| Immigrants | Cuba | 100.0 /100 | #14 | Exceptional 68.2% |
| Assyrians/Chaldeans/Syriacs | 100.0 /100 | #15 | Exceptional 68.2% |