Immigrants from El Salvador vs Pima Family Households
COMPARE
Immigrants from El Salvador
Pima
Family Households
Family Households Comparison
Immigrants from El Salvador
Pima
67.0%
FAMILY HOUSEHOLDS
100.0/ 100
METRIC RATING
39th/ 347
METRIC RANK
65.9%
FAMILY HOUSEHOLDS
99.9/ 100
METRIC RATING
64th/ 347
METRIC RANK
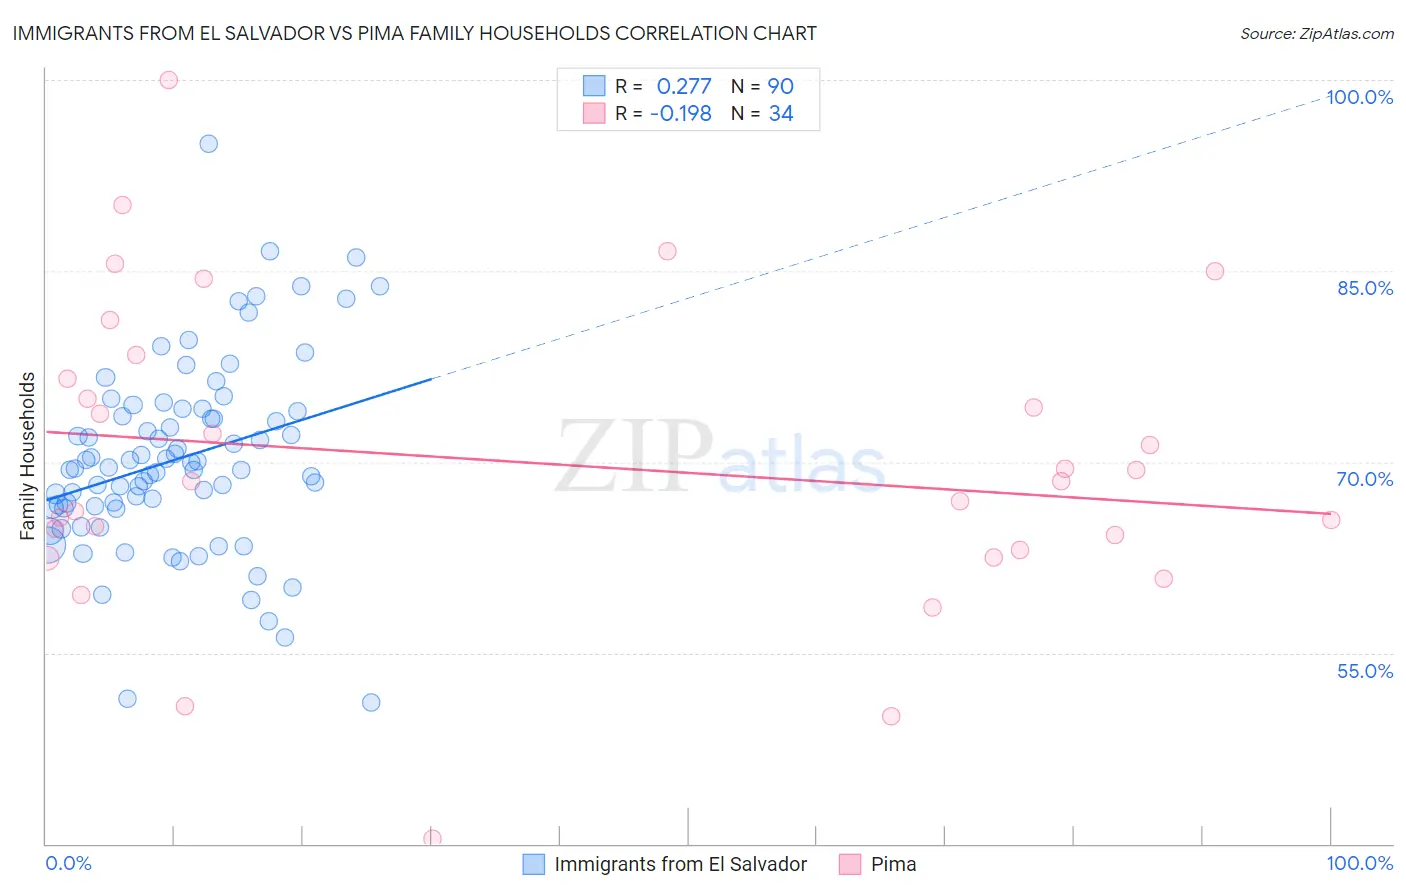
Immigrants from El Salvador vs Pima Family Households Correlation Chart
The statistical analysis conducted on geographies consisting of 357,711,776 people shows a weak positive correlation between the proportion of Immigrants from El Salvador and percentage of family households in the United States with a correlation coefficient (R) of 0.277 and weighted average of 67.0%. Similarly, the statistical analysis conducted on geographies consisting of 61,539,566 people shows a poor negative correlation between the proportion of Pima and percentage of family households in the United States with a correlation coefficient (R) of -0.198 and weighted average of 65.9%, a difference of 1.6%.
Family Households Correlation Summary
| Measurement | Immigrants from El Salvador | Pima |
| Minimum | 51.1% | 40.4% |
| Maximum | 95.0% | 100.0% |
| Range | 43.8% | 59.6% |
| Mean | 70.2% | 69.9% |
| Median | 69.5% | 68.5% |
| Interquartile 25% (IQ1) | 66.4% | 63.1% |
| Interquartile 75% (IQ3) | 73.9% | 76.5% |
| Interquartile Range (IQR) | 7.5% | 13.5% |
| Standard Deviation (Sample) | 7.5% | 12.1% |
| Standard Deviation (Population) | 7.4% | 11.9% |
Similar Demographics by Family Households
Demographics Similar to Immigrants from El Salvador by Family Households
In terms of family households, the demographic groups most similar to Immigrants from El Salvador are Mexican American Indian (67.0%, a difference of 0.020%), Tsimshian (67.1%, a difference of 0.12%), Peruvian (67.1%, a difference of 0.19%), Tohono O'odham (67.1%, a difference of 0.20%), and Salvadoran (67.2%, a difference of 0.25%).
| Demographics | Rating | Rank | Family Households |
| Nepalese | 100.0 /100 | #32 | Exceptional 67.2% |
| Salvadorans | 100.0 /100 | #33 | Exceptional 67.2% |
| Thais | 100.0 /100 | #34 | Exceptional 67.2% |
| Tohono O'odham | 100.0 /100 | #35 | Exceptional 67.1% |
| Peruvians | 100.0 /100 | #36 | Exceptional 67.1% |
| Tsimshian | 100.0 /100 | #37 | Exceptional 67.1% |
| Mexican American Indians | 100.0 /100 | #38 | Exceptional 67.0% |
| Immigrants | El Salvador | 100.0 /100 | #39 | Exceptional 67.0% |
| Guamanians/Chamorros | 100.0 /100 | #40 | Exceptional 66.6% |
| Immigrants | Bolivia | 100.0 /100 | #41 | Exceptional 66.6% |
| Menominee | 100.0 /100 | #42 | Exceptional 66.5% |
| Apache | 100.0 /100 | #43 | Exceptional 66.5% |
| Asians | 100.0 /100 | #44 | Exceptional 66.5% |
| Venezuelans | 100.0 /100 | #45 | Exceptional 66.5% |
| Arapaho | 100.0 /100 | #46 | Exceptional 66.5% |
Demographics Similar to Pima by Family Households
In terms of family households, the demographic groups most similar to Pima are Costa Rican (65.9%, a difference of 0.010%), Fijian (65.9%, a difference of 0.050%), Filipino (65.9%, a difference of 0.050%), Immigrants from Indonesia (66.0%, a difference of 0.060%), and Japanese (65.9%, a difference of 0.070%).
| Demographics | Rating | Rank | Family Households |
| Pennsylvania Germans | 100.0 /100 | #57 | Exceptional 66.1% |
| Immigrants | Asia | 100.0 /100 | #58 | Exceptional 66.1% |
| Immigrants | Korea | 100.0 /100 | #59 | Exceptional 66.0% |
| South Americans | 100.0 /100 | #60 | Exceptional 66.0% |
| Danes | 100.0 /100 | #61 | Exceptional 66.0% |
| Central Americans | 100.0 /100 | #62 | Exceptional 66.0% |
| Immigrants | Indonesia | 100.0 /100 | #63 | Exceptional 66.0% |
| Pima | 99.9 /100 | #64 | Exceptional 65.9% |
| Costa Ricans | 99.9 /100 | #65 | Exceptional 65.9% |
| Fijians | 99.9 /100 | #66 | Exceptional 65.9% |
| Filipinos | 99.9 /100 | #67 | Exceptional 65.9% |
| Japanese | 99.9 /100 | #68 | Exceptional 65.9% |
| Malaysians | 99.9 /100 | #69 | Exceptional 65.9% |
| Immigrants | Afghanistan | 99.9 /100 | #70 | Exceptional 65.9% |
| Bhutanese | 99.9 /100 | #71 | Exceptional 65.9% |