Immigrants from Ecuador vs Immigrants from Dominican Republic In Labor Force | Age 20-24
COMPARE
Immigrants from Ecuador
Immigrants from Dominican Republic
In Labor Force | Age 20-24
In Labor Force | Age 20-24 Comparison
Immigrants from Ecuador
Immigrants from Dominican Republic
72.3%
IN LABOR FORCE | AGE 20-24
0.0/ 100
METRIC RATING
307th/ 347
METRIC RANK
71.2%
IN LABOR FORCE | AGE 20-24
0.0/ 100
METRIC RATING
324th/ 347
METRIC RANK
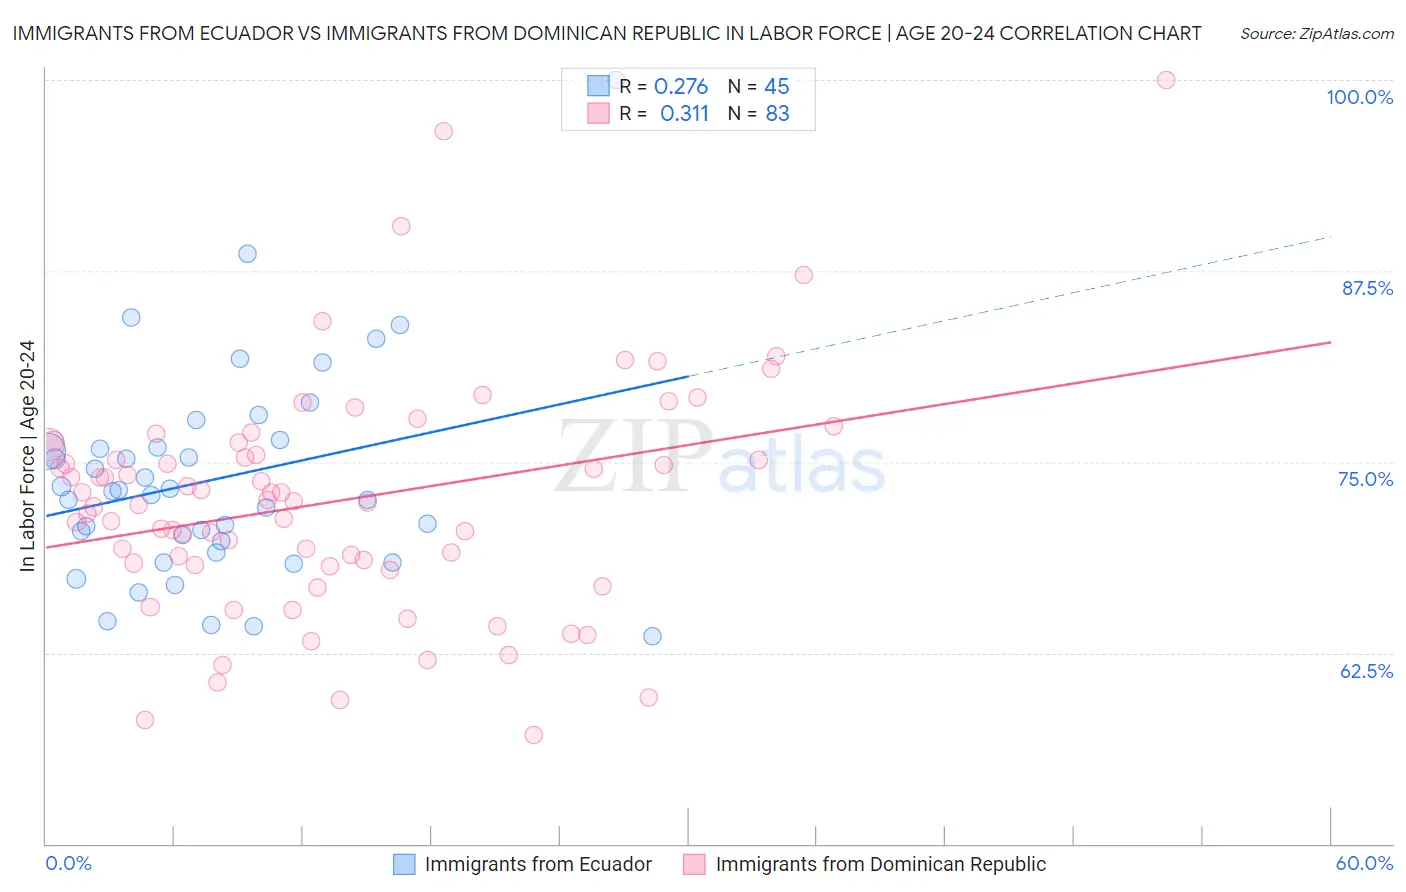
Immigrants from Ecuador vs Immigrants from Dominican Republic In Labor Force | Age 20-24 Correlation Chart
The statistical analysis conducted on geographies consisting of 270,992,575 people shows a weak positive correlation between the proportion of Immigrants from Ecuador and labor force participation rate among population between the ages 20 and 24 in the United States with a correlation coefficient (R) of 0.276 and weighted average of 72.3%. Similarly, the statistical analysis conducted on geographies consisting of 275,100,632 people shows a mild positive correlation between the proportion of Immigrants from Dominican Republic and labor force participation rate among population between the ages 20 and 24 in the United States with a correlation coefficient (R) of 0.311 and weighted average of 71.2%, a difference of 1.5%.
In Labor Force | Age 20-24 Correlation Summary
| Measurement | Immigrants from Ecuador | Immigrants from Dominican Republic |
| Minimum | 63.6% | 57.1% |
| Maximum | 100.0% | 100.0% |
| Range | 36.4% | 42.9% |
| Mean | 73.9% | 72.4% |
| Median | 73.1% | 72.4% |
| Interquartile 25% (IQ1) | 69.4% | 68.2% |
| Interquartile 75% (IQ3) | 76.2% | 76.1% |
| Interquartile Range (IQR) | 6.7% | 7.9% |
| Standard Deviation (Sample) | 7.0% | 7.6% |
| Standard Deviation (Population) | 6.9% | 7.6% |
Demographics Similar to Immigrants from Ecuador and Immigrants from Dominican Republic by In Labor Force | Age 20-24
In terms of in labor force | age 20-24, the demographic groups most similar to Immigrants from Ecuador are Soviet Union (72.3%, a difference of 0.010%), Tsimshian (72.3%, a difference of 0.010%), Immigrants from Jamaica (72.4%, a difference of 0.15%), Immigrants from Singapore (72.4%, a difference of 0.17%), and Immigrants from Cuba (72.0%, a difference of 0.40%). Similarly, the demographic groups most similar to Immigrants from Dominican Republic are West Indian (71.3%, a difference of 0.090%), Barbadian (71.1%, a difference of 0.11%), Filipino (71.4%, a difference of 0.27%), Immigrants from Taiwan (71.5%, a difference of 0.40%), and Trinidadian and Tobagonian (71.5%, a difference of 0.45%).
| Demographics | Rating | Rank | In Labor Force | Age 20-24 |
| Immigrants | Singapore | 0.0 /100 | #305 | Tragic 72.4% |
| Immigrants | Jamaica | 0.0 /100 | #306 | Tragic 72.4% |
| Immigrants | Ecuador | 0.0 /100 | #307 | Tragic 72.3% |
| Soviet Union | 0.0 /100 | #308 | Tragic 72.3% |
| Tsimshian | 0.0 /100 | #309 | Tragic 72.3% |
| Immigrants | Cuba | 0.0 /100 | #310 | Tragic 72.0% |
| Apache | 0.0 /100 | #311 | Tragic 72.0% |
| Immigrants | Caribbean | 0.0 /100 | #312 | Tragic 71.9% |
| Immigrants | Dominica | 0.0 /100 | #313 | Tragic 71.9% |
| Indians (Asian) | 0.0 /100 | #314 | Tragic 71.9% |
| Immigrants | Iran | 0.0 /100 | #315 | Tragic 71.8% |
| Immigrants | Eastern Asia | 0.0 /100 | #316 | Tragic 71.8% |
| Immigrants | Armenia | 0.0 /100 | #317 | Tragic 71.7% |
| Immigrants | Hong Kong | 0.0 /100 | #318 | Tragic 71.6% |
| Immigrants | Israel | 0.0 /100 | #319 | Tragic 71.6% |
| Trinidadians and Tobagonians | 0.0 /100 | #320 | Tragic 71.5% |
| Immigrants | Taiwan | 0.0 /100 | #321 | Tragic 71.5% |
| Filipinos | 0.0 /100 | #322 | Tragic 71.4% |
| West Indians | 0.0 /100 | #323 | Tragic 71.3% |
| Immigrants | Dominican Republic | 0.0 /100 | #324 | Tragic 71.2% |
| Barbadians | 0.0 /100 | #325 | Tragic 71.1% |