Immigrants from Ecuador vs Immigrants from Dominican Republic 7th Grade
COMPARE
Immigrants from Ecuador
Immigrants from Dominican Republic
7th Grade
7th Grade Comparison
Immigrants from Ecuador
Immigrants from Dominican Republic
93.7%
7TH GRADE
0.0/ 100
METRIC RATING
318th/ 347
METRIC RANK
92.9%
7TH GRADE
0.0/ 100
METRIC RATING
330th/ 347
METRIC RANK
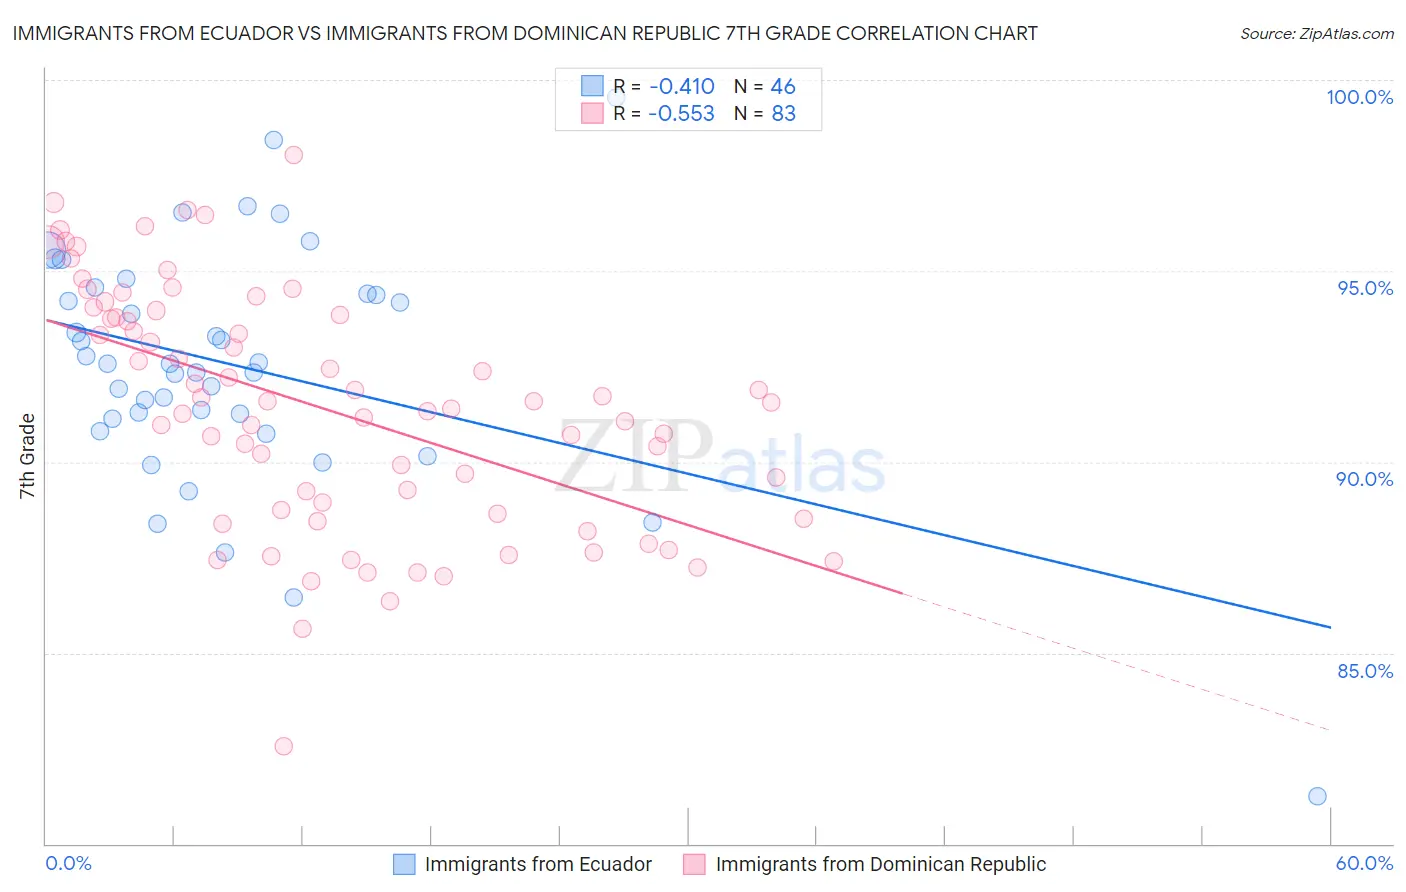
Immigrants from Ecuador vs Immigrants from Dominican Republic 7th Grade Correlation Chart
The statistical analysis conducted on geographies consisting of 270,907,929 people shows a moderate negative correlation between the proportion of Immigrants from Ecuador and percentage of population with at least 7th grade education in the United States with a correlation coefficient (R) of -0.410 and weighted average of 93.7%. Similarly, the statistical analysis conducted on geographies consisting of 275,144,349 people shows a substantial negative correlation between the proportion of Immigrants from Dominican Republic and percentage of population with at least 7th grade education in the United States with a correlation coefficient (R) of -0.553 and weighted average of 92.9%, a difference of 0.89%.
7th Grade Correlation Summary
| Measurement | Immigrants from Ecuador | Immigrants from Dominican Republic |
| Minimum | 81.2% | 82.6% |
| Maximum | 99.5% | 98.1% |
| Range | 18.3% | 15.5% |
| Mean | 92.5% | 91.4% |
| Median | 92.6% | 91.5% |
| Interquartile 25% (IQ1) | 91.1% | 88.6% |
| Interquartile 75% (IQ3) | 94.4% | 93.9% |
| Interquartile Range (IQR) | 3.3% | 5.2% |
| Standard Deviation (Sample) | 3.2% | 3.1% |
| Standard Deviation (Population) | 3.2% | 3.1% |
Demographics Similar to Immigrants from Ecuador and Immigrants from Dominican Republic by 7th Grade
In terms of 7th grade, the demographic groups most similar to Immigrants from Ecuador are Immigrants from Cambodia (93.7%, a difference of 0.030%), Immigrants from Cuba (93.8%, a difference of 0.080%), Immigrants from Vietnam (93.9%, a difference of 0.16%), Vietnamese (93.9%, a difference of 0.19%), and Immigrants from Fiji (93.5%, a difference of 0.21%). Similarly, the demographic groups most similar to Immigrants from Dominican Republic are Honduran (92.9%, a difference of 0.040%), Immigrants from the Azores (93.0%, a difference of 0.050%), Immigrants from Nicaragua (93.0%, a difference of 0.090%), Hispanic or Latino (92.7%, a difference of 0.18%), and Immigrants from Armenia (92.7%, a difference of 0.20%).
| Demographics | Rating | Rank | 7th Grade |
| Japanese | 0.0 /100 | #314 | Tragic 94.0% |
| Vietnamese | 0.0 /100 | #315 | Tragic 93.9% |
| Immigrants | Vietnam | 0.0 /100 | #316 | Tragic 93.9% |
| Immigrants | Cuba | 0.0 /100 | #317 | Tragic 93.8% |
| Immigrants | Ecuador | 0.0 /100 | #318 | Tragic 93.7% |
| Immigrants | Cambodia | 0.0 /100 | #319 | Tragic 93.7% |
| Immigrants | Fiji | 0.0 /100 | #320 | Tragic 93.5% |
| Belizeans | 0.0 /100 | #321 | Tragic 93.5% |
| Nicaraguans | 0.0 /100 | #322 | Tragic 93.5% |
| Immigrants | Belize | 0.0 /100 | #323 | Tragic 93.4% |
| Dominicans | 0.0 /100 | #324 | Tragic 93.3% |
| Central American Indians | 0.0 /100 | #325 | Tragic 93.3% |
| Nepalese | 0.0 /100 | #326 | Tragic 93.2% |
| Immigrants | Cabo Verde | 0.0 /100 | #327 | Tragic 93.1% |
| Immigrants | Nicaragua | 0.0 /100 | #328 | Tragic 93.0% |
| Immigrants | Azores | 0.0 /100 | #329 | Tragic 93.0% |
| Immigrants | Dominican Republic | 0.0 /100 | #330 | Tragic 92.9% |
| Hondurans | 0.0 /100 | #331 | Tragic 92.9% |
| Hispanics or Latinos | 0.0 /100 | #332 | Tragic 92.7% |
| Immigrants | Armenia | 0.0 /100 | #333 | Tragic 92.7% |
| Immigrants | Yemen | 0.0 /100 | #334 | Tragic 92.6% |