Immigrants from Eastern Asia vs Immigrants from Moldova Currently Married
COMPARE
Immigrants from Eastern Asia
Immigrants from Moldova
Currently Married
Currently Married Comparison
Immigrants from Eastern Asia
Immigrants from Moldova
48.2%
CURRENTLY MARRIED
97.5/ 100
METRIC RATING
73rd/ 347
METRIC RANK
48.5%
CURRENTLY MARRIED
98.7/ 100
METRIC RATING
54th/ 347
METRIC RANK
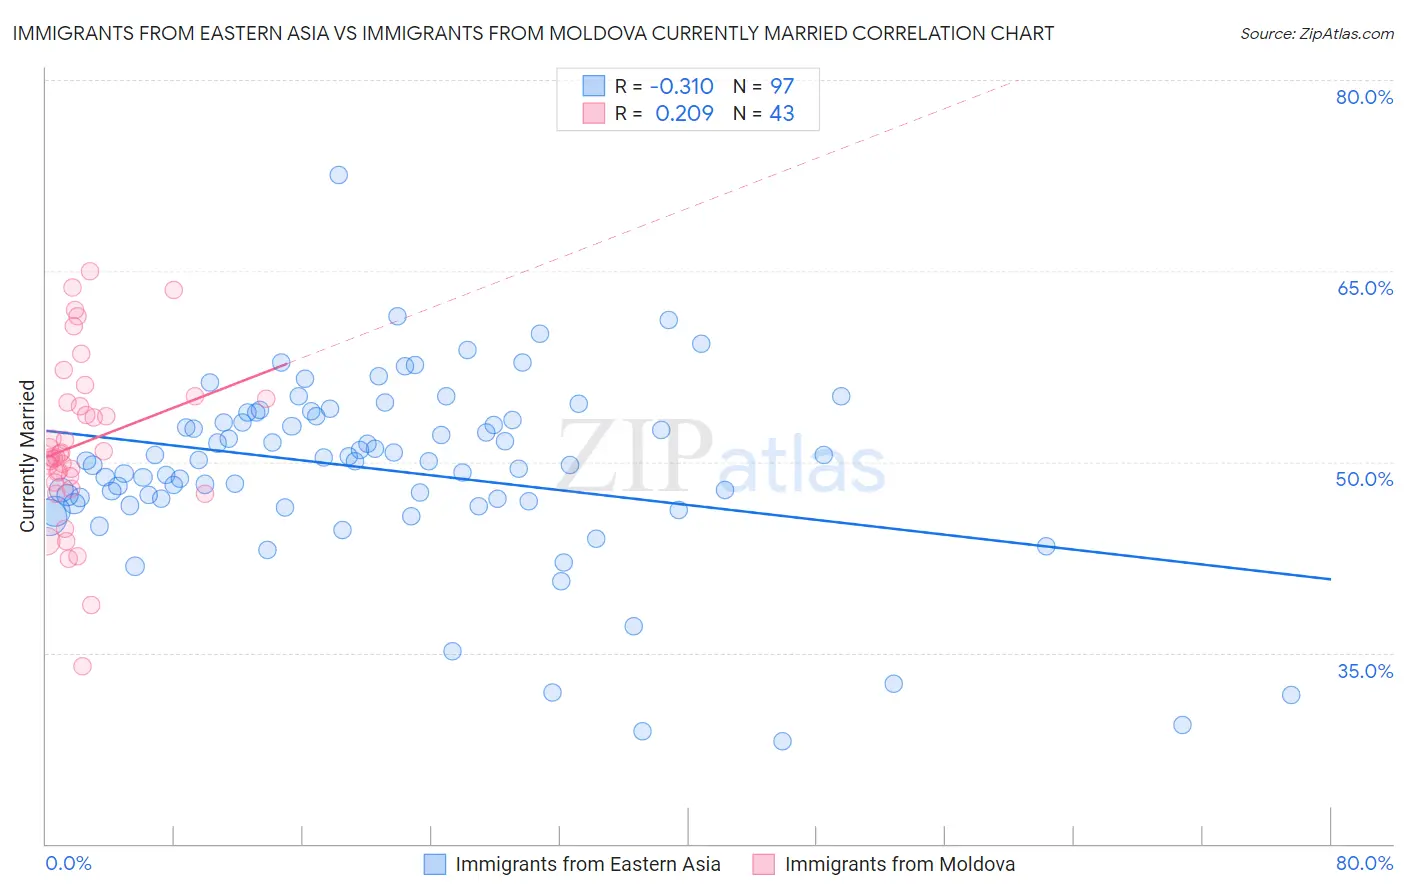
Immigrants from Eastern Asia vs Immigrants from Moldova Currently Married Correlation Chart
The statistical analysis conducted on geographies consisting of 499,820,876 people shows a mild negative correlation between the proportion of Immigrants from Eastern Asia and percentage of population currently married in the United States with a correlation coefficient (R) of -0.310 and weighted average of 48.2%. Similarly, the statistical analysis conducted on geographies consisting of 124,399,411 people shows a weak positive correlation between the proportion of Immigrants from Moldova and percentage of population currently married in the United States with a correlation coefficient (R) of 0.209 and weighted average of 48.5%, a difference of 0.57%.
Currently Married Correlation Summary
| Measurement | Immigrants from Eastern Asia | Immigrants from Moldova |
| Minimum | 28.1% | 33.9% |
| Maximum | 72.5% | 65.0% |
| Range | 44.4% | 31.1% |
| Mean | 49.4% | 51.5% |
| Median | 50.0% | 50.6% |
| Interquartile 25% (IQ1) | 46.8% | 48.4% |
| Interquartile 75% (IQ3) | 53.5% | 55.0% |
| Interquartile Range (IQR) | 6.7% | 6.6% |
| Standard Deviation (Sample) | 7.2% | 6.6% |
| Standard Deviation (Population) | 7.2% | 6.5% |
Demographics Similar to Immigrants from Eastern Asia and Immigrants from Moldova by Currently Married
In terms of currently married, the demographic groups most similar to Immigrants from Eastern Asia are Immigrants from Lebanon (48.2%, a difference of 0.020%), Immigrants from Asia (48.3%, a difference of 0.17%), Macedonian (48.3%, a difference of 0.17%), Canadian (48.3%, a difference of 0.26%), and Slovak (48.3%, a difference of 0.28%). Similarly, the demographic groups most similar to Immigrants from Moldova are Immigrants from North Macedonia (48.5%, a difference of 0.0%), Latvian (48.5%, a difference of 0.0%), Immigrants from Netherlands (48.5%, a difference of 0.030%), Immigrants from Austria (48.5%, a difference of 0.060%), and French (48.4%, a difference of 0.080%).
| Demographics | Rating | Rank | Currently Married |
| Immigrants | Austria | 98.8 /100 | #53 | Exceptional 48.5% |
| Immigrants | Moldova | 98.7 /100 | #54 | Exceptional 48.5% |
| Immigrants | North Macedonia | 98.7 /100 | #55 | Exceptional 48.5% |
| Latvians | 98.7 /100 | #56 | Exceptional 48.5% |
| Immigrants | Netherlands | 98.6 /100 | #57 | Exceptional 48.5% |
| French | 98.6 /100 | #58 | Exceptional 48.4% |
| Immigrants | Ireland | 98.5 /100 | #59 | Exceptional 48.4% |
| Immigrants | Romania | 98.5 /100 | #60 | Exceptional 48.4% |
| Romanians | 98.5 /100 | #61 | Exceptional 48.4% |
| Asians | 98.5 /100 | #62 | Exceptional 48.4% |
| Slavs | 98.3 /100 | #63 | Exceptional 48.4% |
| Immigrants | Czechoslovakia | 98.3 /100 | #64 | Exceptional 48.4% |
| Ukrainians | 98.3 /100 | #65 | Exceptional 48.4% |
| Tongans | 98.2 /100 | #66 | Exceptional 48.3% |
| Slovaks | 98.2 /100 | #67 | Exceptional 48.3% |
| Immigrants | England | 98.2 /100 | #68 | Exceptional 48.3% |
| Canadians | 98.1 /100 | #69 | Exceptional 48.3% |
| Immigrants | Asia | 97.9 /100 | #70 | Exceptional 48.3% |
| Macedonians | 97.9 /100 | #71 | Exceptional 48.3% |
| Immigrants | Lebanon | 97.6 /100 | #72 | Exceptional 48.2% |
| Immigrants | Eastern Asia | 97.5 /100 | #73 | Exceptional 48.2% |