Immigrants from Eastern Asia vs Immigrants from Netherlands Currently Married
COMPARE
Immigrants from Eastern Asia
Immigrants from Netherlands
Currently Married
Currently Married Comparison
Immigrants from Eastern Asia
Immigrants from Netherlands
48.2%
CURRENTLY MARRIED
97.5/ 100
METRIC RATING
73rd/ 347
METRIC RANK
48.5%
CURRENTLY MARRIED
98.6/ 100
METRIC RATING
57th/ 347
METRIC RANK
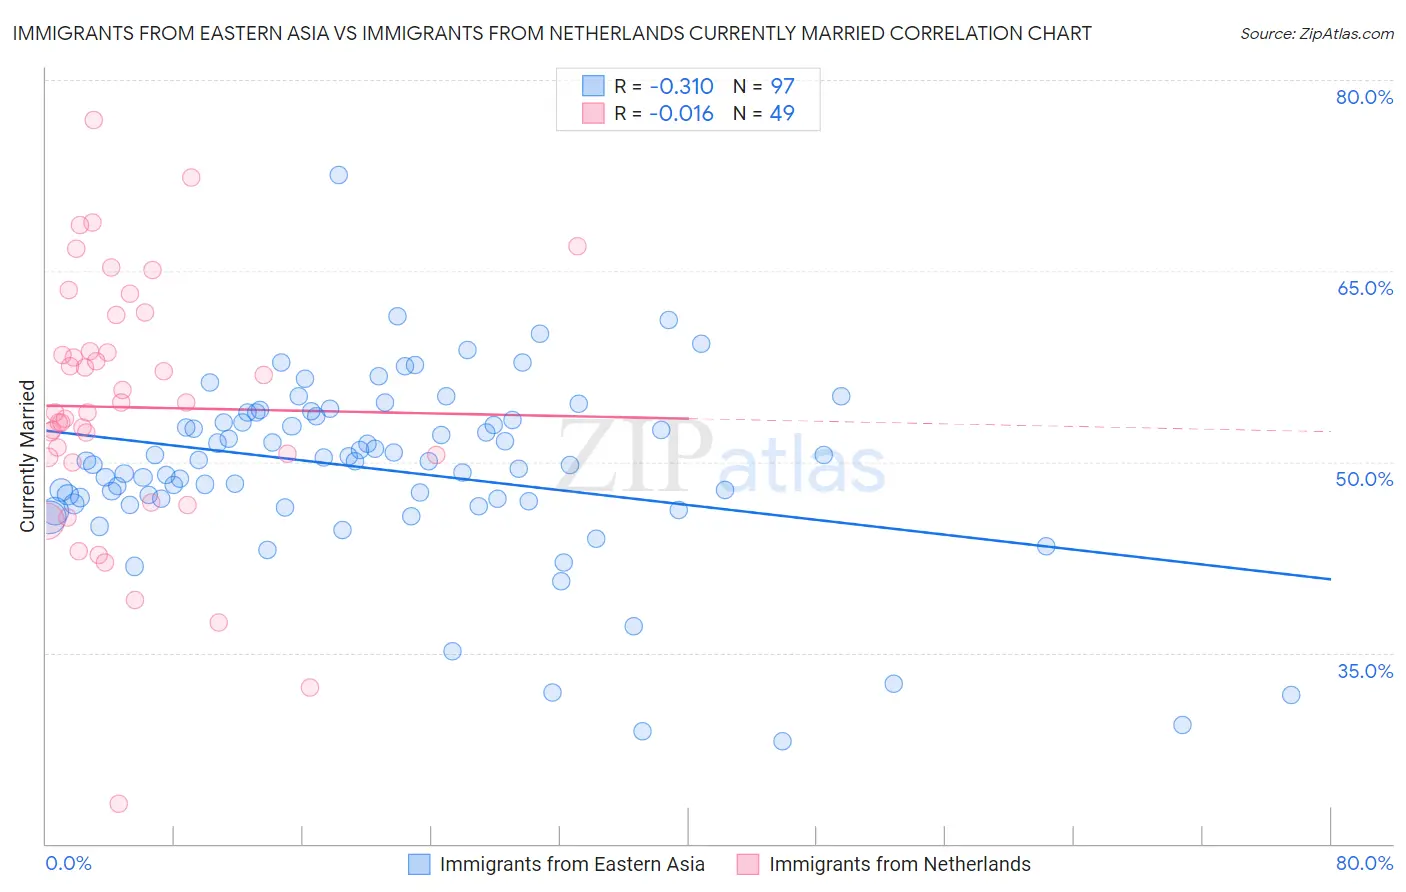
Immigrants from Eastern Asia vs Immigrants from Netherlands Currently Married Correlation Chart
The statistical analysis conducted on geographies consisting of 499,820,876 people shows a mild negative correlation between the proportion of Immigrants from Eastern Asia and percentage of population currently married in the United States with a correlation coefficient (R) of -0.310 and weighted average of 48.2%. Similarly, the statistical analysis conducted on geographies consisting of 237,864,062 people shows no correlation between the proportion of Immigrants from Netherlands and percentage of population currently married in the United States with a correlation coefficient (R) of -0.016 and weighted average of 48.5%, a difference of 0.54%.
Currently Married Correlation Summary
| Measurement | Immigrants from Eastern Asia | Immigrants from Netherlands |
| Minimum | 28.1% | 23.1% |
| Maximum | 72.5% | 76.9% |
| Range | 44.4% | 53.8% |
| Mean | 49.4% | 54.3% |
| Median | 50.0% | 53.9% |
| Interquartile 25% (IQ1) | 46.8% | 50.2% |
| Interquartile 75% (IQ3) | 53.5% | 60.2% |
| Interquartile Range (IQR) | 6.7% | 10.0% |
| Standard Deviation (Sample) | 7.2% | 10.1% |
| Standard Deviation (Population) | 7.2% | 10.0% |
Demographics Similar to Immigrants from Eastern Asia and Immigrants from Netherlands by Currently Married
In terms of currently married, the demographic groups most similar to Immigrants from Eastern Asia are Immigrants from Lebanon (48.2%, a difference of 0.020%), Estonian (48.2%, a difference of 0.030%), Immigrants from Belarus (48.1%, a difference of 0.10%), Immigrants from Asia (48.3%, a difference of 0.17%), and Macedonian (48.3%, a difference of 0.17%). Similarly, the demographic groups most similar to Immigrants from Netherlands are Immigrants from North Macedonia (48.5%, a difference of 0.030%), Latvian (48.5%, a difference of 0.030%), French (48.4%, a difference of 0.040%), Immigrants from Ireland (48.4%, a difference of 0.070%), and Immigrants from Romania (48.4%, a difference of 0.090%).
| Demographics | Rating | Rank | Currently Married |
| Immigrants | North Macedonia | 98.7 /100 | #55 | Exceptional 48.5% |
| Latvians | 98.7 /100 | #56 | Exceptional 48.5% |
| Immigrants | Netherlands | 98.6 /100 | #57 | Exceptional 48.5% |
| French | 98.6 /100 | #58 | Exceptional 48.4% |
| Immigrants | Ireland | 98.5 /100 | #59 | Exceptional 48.4% |
| Immigrants | Romania | 98.5 /100 | #60 | Exceptional 48.4% |
| Romanians | 98.5 /100 | #61 | Exceptional 48.4% |
| Asians | 98.5 /100 | #62 | Exceptional 48.4% |
| Slavs | 98.3 /100 | #63 | Exceptional 48.4% |
| Immigrants | Czechoslovakia | 98.3 /100 | #64 | Exceptional 48.4% |
| Ukrainians | 98.3 /100 | #65 | Exceptional 48.4% |
| Tongans | 98.2 /100 | #66 | Exceptional 48.3% |
| Slovaks | 98.2 /100 | #67 | Exceptional 48.3% |
| Immigrants | England | 98.2 /100 | #68 | Exceptional 48.3% |
| Canadians | 98.1 /100 | #69 | Exceptional 48.3% |
| Immigrants | Asia | 97.9 /100 | #70 | Exceptional 48.3% |
| Macedonians | 97.9 /100 | #71 | Exceptional 48.3% |
| Immigrants | Lebanon | 97.6 /100 | #72 | Exceptional 48.2% |
| Immigrants | Eastern Asia | 97.5 /100 | #73 | Exceptional 48.2% |
| Estonians | 97.4 /100 | #74 | Exceptional 48.2% |
| Immigrants | Belarus | 97.2 /100 | #75 | Exceptional 48.1% |