Immigrants from Croatia vs Scotch-Irish Currently Married
COMPARE
Immigrants from Croatia
Scotch-Irish
Currently Married
Currently Married Comparison
Immigrants from Croatia
Scotch-Irish
47.5%
CURRENTLY MARRIED
88.6/ 100
METRIC RATING
121st/ 347
METRIC RANK
48.7%
CURRENTLY MARRIED
99.3/ 100
METRIC RATING
43rd/ 347
METRIC RANK
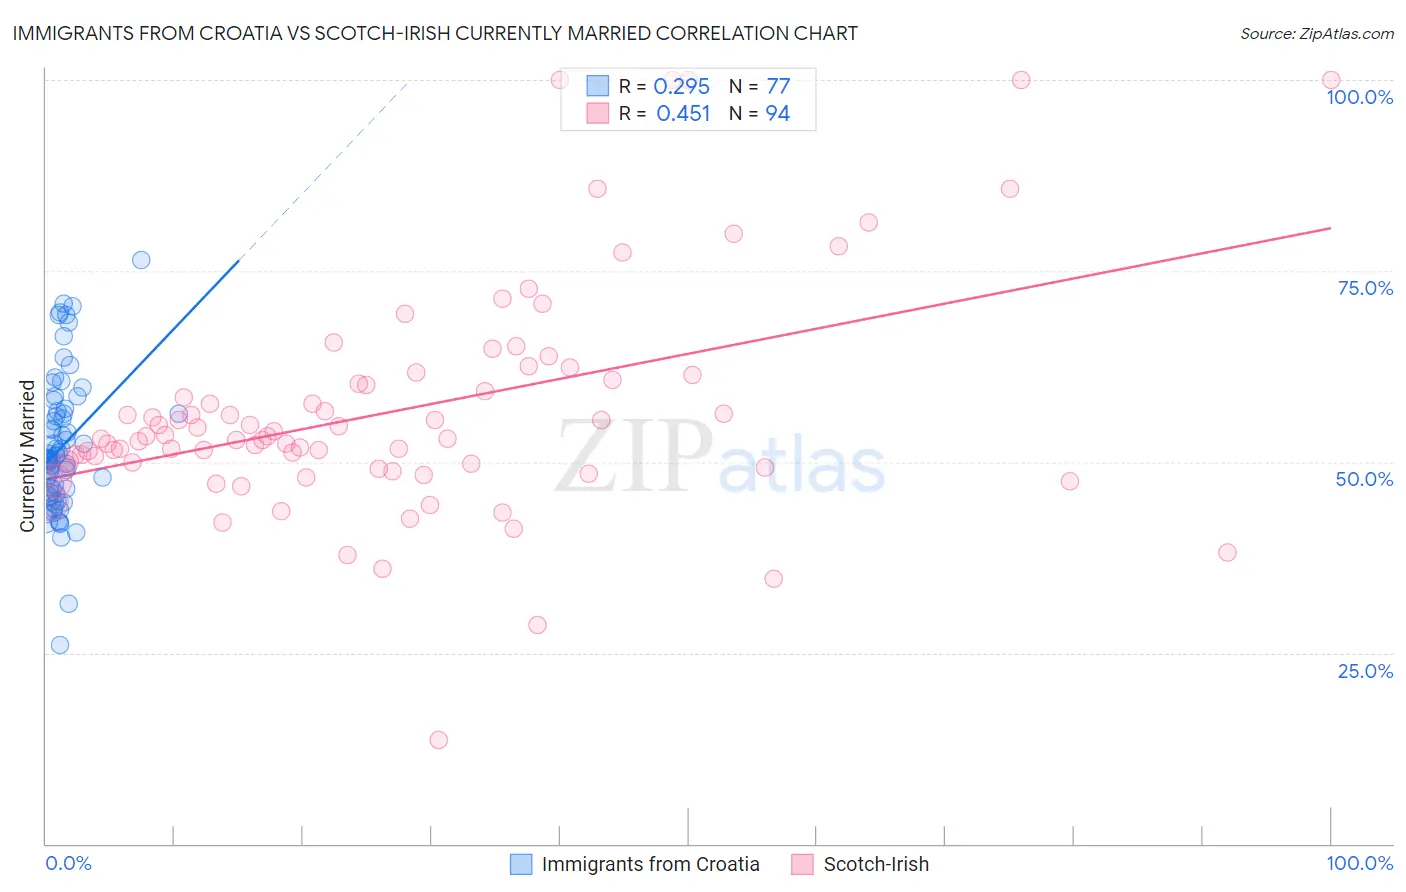
Immigrants from Croatia vs Scotch-Irish Currently Married Correlation Chart
The statistical analysis conducted on geographies consisting of 132,574,468 people shows a weak positive correlation between the proportion of Immigrants from Croatia and percentage of population currently married in the United States with a correlation coefficient (R) of 0.295 and weighted average of 47.5%. Similarly, the statistical analysis conducted on geographies consisting of 548,698,308 people shows a moderate positive correlation between the proportion of Scotch-Irish and percentage of population currently married in the United States with a correlation coefficient (R) of 0.451 and weighted average of 48.7%, a difference of 2.6%.
Currently Married Correlation Summary
| Measurement | Immigrants from Croatia | Scotch-Irish |
| Minimum | 26.0% | 13.6% |
| Maximum | 76.4% | 100.0% |
| Range | 50.4% | 86.4% |
| Mean | 51.9% | 56.8% |
| Median | 50.4% | 53.2% |
| Interquartile 25% (IQ1) | 45.9% | 49.2% |
| Interquartile 75% (IQ3) | 56.5% | 60.7% |
| Interquartile Range (IQR) | 10.5% | 11.5% |
| Standard Deviation (Sample) | 9.0% | 15.2% |
| Standard Deviation (Population) | 8.9% | 15.1% |
Similar Demographics by Currently Married
Demographics Similar to Immigrants from Croatia by Currently Married
In terms of currently married, the demographic groups most similar to Immigrants from Croatia are Syrian (47.5%, a difference of 0.030%), Osage (47.5%, a difference of 0.060%), Immigrants from Kazakhstan (47.4%, a difference of 0.12%), Immigrants from Philippines (47.6%, a difference of 0.15%), and Australian (47.6%, a difference of 0.15%).
| Demographics | Rating | Rank | Currently Married |
| South Africans | 90.5 /100 | #114 | Exceptional 47.6% |
| Immigrants | Indonesia | 90.5 /100 | #115 | Exceptional 47.6% |
| Palestinians | 90.4 /100 | #116 | Exceptional 47.6% |
| Puget Sound Salish | 90.3 /100 | #117 | Exceptional 47.6% |
| Immigrants | Philippines | 90.2 /100 | #118 | Exceptional 47.6% |
| Australians | 90.2 /100 | #119 | Exceptional 47.6% |
| Syrians | 88.9 /100 | #120 | Excellent 47.5% |
| Immigrants | Croatia | 88.6 /100 | #121 | Excellent 47.5% |
| Osage | 87.9 /100 | #122 | Excellent 47.5% |
| Immigrants | Kazakhstan | 87.2 /100 | #123 | Excellent 47.4% |
| Laotians | 86.6 /100 | #124 | Excellent 47.4% |
| Okinawans | 85.3 /100 | #125 | Excellent 47.4% |
| Immigrants | Jordan | 84.9 /100 | #126 | Excellent 47.4% |
| New Zealanders | 84.9 /100 | #127 | Excellent 47.4% |
| Portuguese | 84.2 /100 | #128 | Excellent 47.3% |
Demographics Similar to Scotch-Irish by Currently Married
In terms of currently married, the demographic groups most similar to Scotch-Irish are Finnish (48.8%, a difference of 0.010%), Immigrants from North America (48.7%, a difference of 0.030%), Greek (48.8%, a difference of 0.050%), Belgian (48.7%, a difference of 0.060%), and Immigrants from Canada (48.8%, a difference of 0.070%).
| Demographics | Rating | Rank | Currently Married |
| Italians | 99.4 /100 | #36 | Exceptional 48.8% |
| Hungarians | 99.4 /100 | #37 | Exceptional 48.8% |
| Czechoslovakians | 99.4 /100 | #38 | Exceptional 48.8% |
| British | 99.4 /100 | #39 | Exceptional 48.8% |
| Immigrants | Canada | 99.4 /100 | #40 | Exceptional 48.8% |
| Greeks | 99.3 /100 | #41 | Exceptional 48.8% |
| Finns | 99.3 /100 | #42 | Exceptional 48.8% |
| Scotch-Irish | 99.3 /100 | #43 | Exceptional 48.7% |
| Immigrants | North America | 99.3 /100 | #44 | Exceptional 48.7% |
| Belgians | 99.3 /100 | #45 | Exceptional 48.7% |
| Immigrants | Iran | 99.2 /100 | #46 | Exceptional 48.7% |
| Northern Europeans | 99.2 /100 | #47 | Exceptional 48.7% |
| Austrians | 99.2 /100 | #48 | Exceptional 48.7% |
| Bhutanese | 99.1 /100 | #49 | Exceptional 48.6% |
| Iranians | 99.0 /100 | #50 | Exceptional 48.6% |