Immigrants from Croatia vs West Indian Currently Married
COMPARE
Immigrants from Croatia
West Indian
Currently Married
Currently Married Comparison
Immigrants from Croatia
West Indians
47.5%
CURRENTLY MARRIED
88.6/ 100
METRIC RATING
121st/ 347
METRIC RANK
41.3%
CURRENTLY MARRIED
0.0/ 100
METRIC RATING
314th/ 347
METRIC RANK
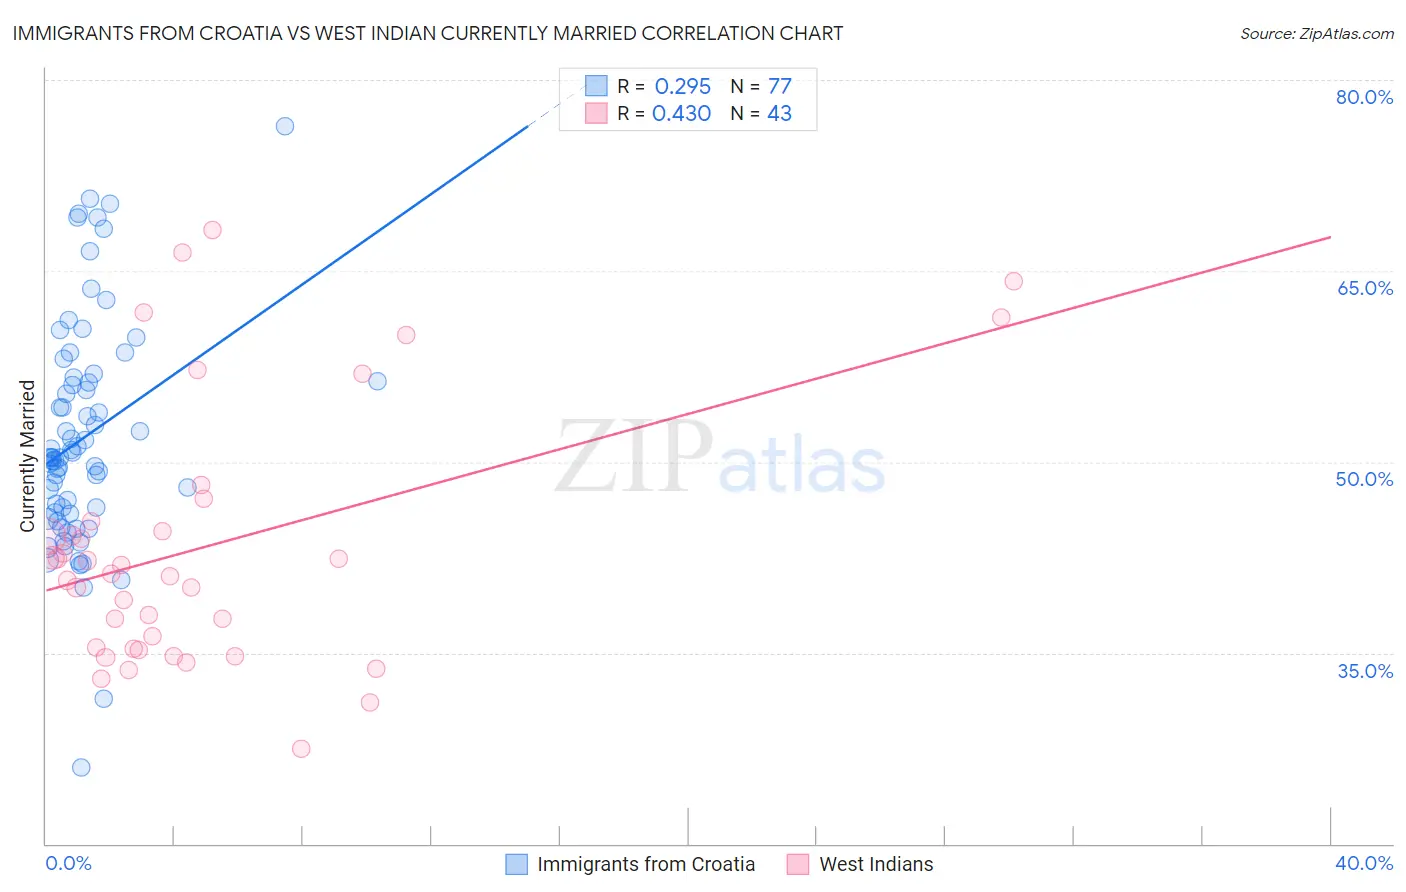
Immigrants from Croatia vs West Indian Currently Married Correlation Chart
The statistical analysis conducted on geographies consisting of 132,574,468 people shows a weak positive correlation between the proportion of Immigrants from Croatia and percentage of population currently married in the United States with a correlation coefficient (R) of 0.295 and weighted average of 47.5%. Similarly, the statistical analysis conducted on geographies consisting of 254,034,527 people shows a moderate positive correlation between the proportion of West Indians and percentage of population currently married in the United States with a correlation coefficient (R) of 0.430 and weighted average of 41.3%, a difference of 15.0%.
Currently Married Correlation Summary
| Measurement | Immigrants from Croatia | West Indian |
| Minimum | 26.0% | 27.5% |
| Maximum | 76.4% | 68.2% |
| Range | 50.4% | 40.7% |
| Mean | 51.9% | 43.3% |
| Median | 50.4% | 41.3% |
| Interquartile 25% (IQ1) | 45.9% | 35.3% |
| Interquartile 75% (IQ3) | 56.5% | 45.4% |
| Interquartile Range (IQR) | 10.5% | 10.0% |
| Standard Deviation (Sample) | 9.0% | 10.2% |
| Standard Deviation (Population) | 8.9% | 10.1% |
Similar Demographics by Currently Married
Demographics Similar to Immigrants from Croatia by Currently Married
In terms of currently married, the demographic groups most similar to Immigrants from Croatia are Syrian (47.5%, a difference of 0.030%), Osage (47.5%, a difference of 0.060%), Immigrants from Kazakhstan (47.4%, a difference of 0.12%), Immigrants from Philippines (47.6%, a difference of 0.15%), and Australian (47.6%, a difference of 0.15%).
| Demographics | Rating | Rank | Currently Married |
| South Africans | 90.5 /100 | #114 | Exceptional 47.6% |
| Immigrants | Indonesia | 90.5 /100 | #115 | Exceptional 47.6% |
| Palestinians | 90.4 /100 | #116 | Exceptional 47.6% |
| Puget Sound Salish | 90.3 /100 | #117 | Exceptional 47.6% |
| Immigrants | Philippines | 90.2 /100 | #118 | Exceptional 47.6% |
| Australians | 90.2 /100 | #119 | Exceptional 47.6% |
| Syrians | 88.9 /100 | #120 | Excellent 47.5% |
| Immigrants | Croatia | 88.6 /100 | #121 | Excellent 47.5% |
| Osage | 87.9 /100 | #122 | Excellent 47.5% |
| Immigrants | Kazakhstan | 87.2 /100 | #123 | Excellent 47.4% |
| Laotians | 86.6 /100 | #124 | Excellent 47.4% |
| Okinawans | 85.3 /100 | #125 | Excellent 47.4% |
| Immigrants | Jordan | 84.9 /100 | #126 | Excellent 47.4% |
| New Zealanders | 84.9 /100 | #127 | Excellent 47.4% |
| Portuguese | 84.2 /100 | #128 | Excellent 47.3% |
Demographics Similar to West Indians by Currently Married
In terms of currently married, the demographic groups most similar to West Indians are Jamaican (41.4%, a difference of 0.080%), Inupiat (41.3%, a difference of 0.090%), Immigrants from Caribbean (41.3%, a difference of 0.15%), Haitian (41.3%, a difference of 0.17%), and Bahamian (41.2%, a difference of 0.35%).
| Demographics | Rating | Rank | Currently Married |
| Africans | 0.0 /100 | #307 | Tragic 41.8% |
| Immigrants | Belize | 0.0 /100 | #308 | Tragic 41.8% |
| Immigrants | Liberia | 0.0 /100 | #309 | Tragic 41.8% |
| Guyanese | 0.0 /100 | #310 | Tragic 41.6% |
| Trinidadians and Tobagonians | 0.0 /100 | #311 | Tragic 41.5% |
| Somalis | 0.0 /100 | #312 | Tragic 41.5% |
| Jamaicans | 0.0 /100 | #313 | Tragic 41.4% |
| West Indians | 0.0 /100 | #314 | Tragic 41.3% |
| Inupiat | 0.0 /100 | #315 | Tragic 41.3% |
| Immigrants | Caribbean | 0.0 /100 | #316 | Tragic 41.3% |
| Haitians | 0.0 /100 | #317 | Tragic 41.3% |
| Bahamians | 0.0 /100 | #318 | Tragic 41.2% |
| Immigrants | Somalia | 0.0 /100 | #319 | Tragic 41.2% |
| Immigrants | Jamaica | 0.0 /100 | #320 | Tragic 41.1% |
| Immigrants | Congo | 0.0 /100 | #321 | Tragic 41.1% |