Immigrants from Croatia vs Scotch-Irish Master's Degree
COMPARE
Immigrants from Croatia
Scotch-Irish
Master's Degree
Master's Degree Comparison
Immigrants from Croatia
Scotch-Irish
17.3%
MASTER'S DEGREE
99.3/ 100
METRIC RATING
86th/ 347
METRIC RANK
14.4%
MASTER'S DEGREE
25.0/ 100
METRIC RATING
201st/ 347
METRIC RANK
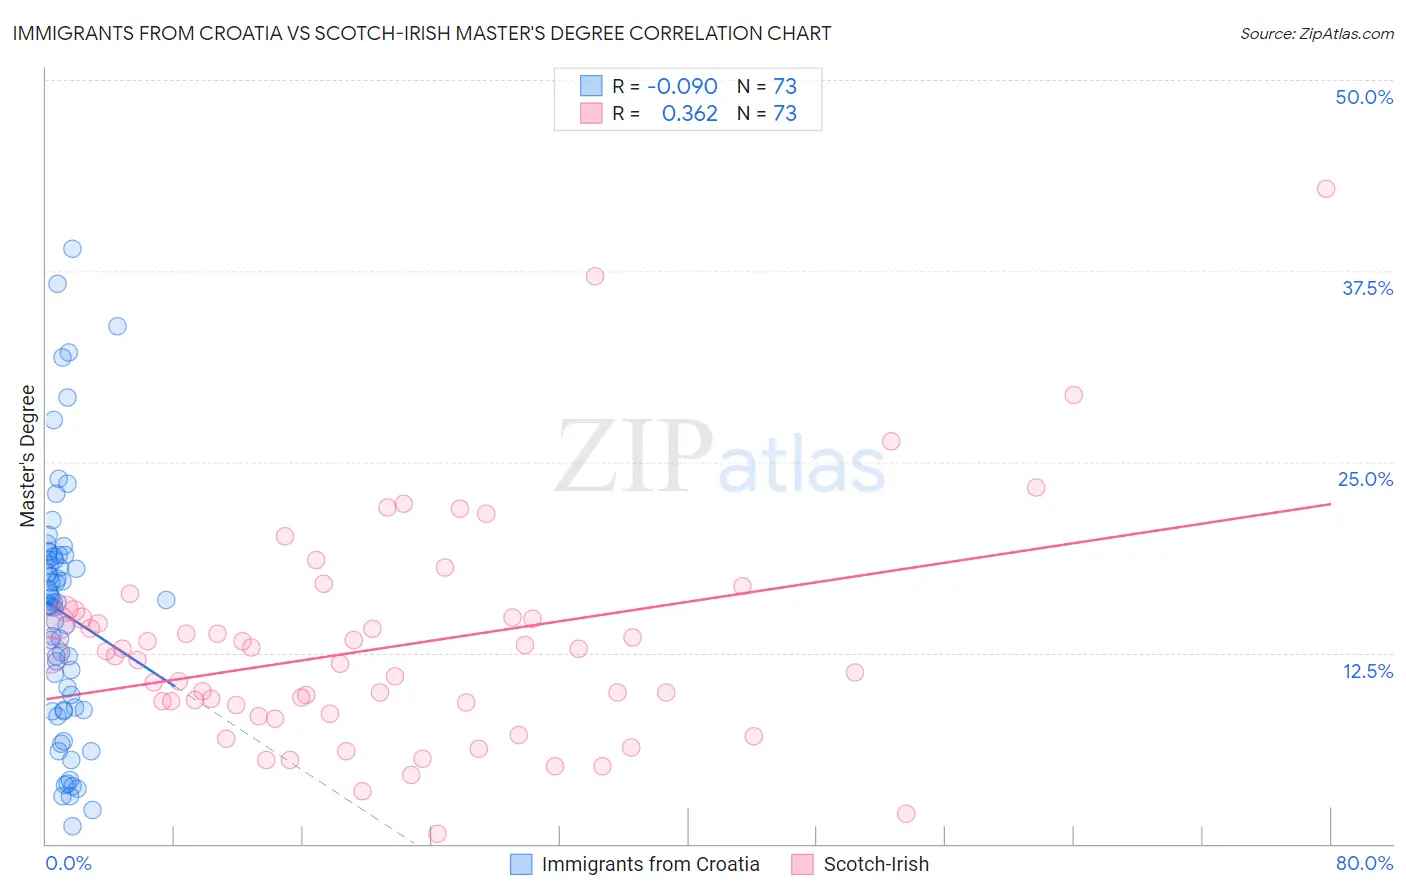
Immigrants from Croatia vs Scotch-Irish Master's Degree Correlation Chart
The statistical analysis conducted on geographies consisting of 132,554,836 people shows a slight negative correlation between the proportion of Immigrants from Croatia and percentage of population with at least master's degree education in the United States with a correlation coefficient (R) of -0.090 and weighted average of 17.3%. Similarly, the statistical analysis conducted on geographies consisting of 548,205,332 people shows a mild positive correlation between the proportion of Scotch-Irish and percentage of population with at least master's degree education in the United States with a correlation coefficient (R) of 0.362 and weighted average of 14.4%, a difference of 20.0%.
Master's Degree Correlation Summary
| Measurement | Immigrants from Croatia | Scotch-Irish |
| Minimum | 1.2% | 0.67% |
| Maximum | 39.0% | 42.9% |
| Range | 37.8% | 42.2% |
| Mean | 15.1% | 12.9% |
| Median | 15.7% | 12.3% |
| Interquartile 25% (IQ1) | 8.8% | 8.8% |
| Interquartile 75% (IQ3) | 18.8% | 14.8% |
| Interquartile Range (IQR) | 10.1% | 6.0% |
| Standard Deviation (Sample) | 8.2% | 7.2% |
| Standard Deviation (Population) | 8.1% | 7.1% |
Similar Demographics by Master's Degree
Demographics Similar to Immigrants from Croatia by Master's Degree
In terms of master's degree, the demographic groups most similar to Immigrants from Croatia are Maltese (17.3%, a difference of 0.10%), Immigrants from Brazil (17.4%, a difference of 0.41%), Immigrants from Canada (17.2%, a difference of 0.46%), Bhutanese (17.2%, a difference of 0.53%), and Immigrants from Egypt (17.2%, a difference of 0.55%).
| Demographics | Rating | Rank | Master's Degree |
| Immigrants | Lebanon | 99.6 /100 | #79 | Exceptional 17.5% |
| Carpatho Rusyns | 99.6 /100 | #80 | Exceptional 17.5% |
| Immigrants | Western Asia | 99.5 /100 | #81 | Exceptional 17.5% |
| Greeks | 99.5 /100 | #82 | Exceptional 17.5% |
| Immigrants | Zimbabwe | 99.5 /100 | #83 | Exceptional 17.4% |
| Immigrants | Scotland | 99.4 /100 | #84 | Exceptional 17.4% |
| Immigrants | Brazil | 99.4 /100 | #85 | Exceptional 17.4% |
| Immigrants | Croatia | 99.3 /100 | #86 | Exceptional 17.3% |
| Maltese | 99.3 /100 | #87 | Exceptional 17.3% |
| Immigrants | Canada | 99.2 /100 | #88 | Exceptional 17.2% |
| Bhutanese | 99.1 /100 | #89 | Exceptional 17.2% |
| Immigrants | Egypt | 99.1 /100 | #90 | Exceptional 17.2% |
| Romanians | 99.1 /100 | #91 | Exceptional 17.2% |
| Immigrants | North America | 99.1 /100 | #92 | Exceptional 17.2% |
| Immigrants | Italy | 99.1 /100 | #93 | Exceptional 17.2% |
Demographics Similar to Scotch-Irish by Master's Degree
In terms of master's degree, the demographic groups most similar to Scotch-Irish are Panamanian (14.4%, a difference of 0.010%), Immigrants from Western Africa (14.4%, a difference of 0.010%), Yugoslavian (14.4%, a difference of 0.13%), French (14.4%, a difference of 0.24%), and Trinidadian and Tobagonian (14.4%, a difference of 0.27%).
| Demographics | Rating | Rank | Master's Degree |
| Chinese | 32.5 /100 | #194 | Fair 14.6% |
| Danes | 31.3 /100 | #195 | Fair 14.5% |
| Czechoslovakians | 29.9 /100 | #196 | Fair 14.5% |
| Belgians | 28.0 /100 | #197 | Fair 14.5% |
| West Indians | 27.4 /100 | #198 | Fair 14.5% |
| Immigrants | Armenia | 27.2 /100 | #199 | Fair 14.5% |
| Panamanians | 25.1 /100 | #200 | Fair 14.4% |
| Scotch-Irish | 25.0 /100 | #201 | Fair 14.4% |
| Immigrants | Western Africa | 24.9 /100 | #202 | Fair 14.4% |
| Yugoslavians | 24.3 /100 | #203 | Fair 14.4% |
| French | 23.7 /100 | #204 | Fair 14.4% |
| Trinidadians and Tobagonians | 23.5 /100 | #205 | Fair 14.4% |
| Scandinavians | 23.3 /100 | #206 | Fair 14.4% |
| Immigrants | Bosnia and Herzegovina | 22.0 /100 | #207 | Fair 14.3% |
| Immigrants | Barbados | 20.5 /100 | #208 | Fair 14.3% |