Immigrants from Croatia vs Iraqi Currently Married
COMPARE
Immigrants from Croatia
Iraqi
Currently Married
Currently Married Comparison
Immigrants from Croatia
Iraqis
47.5%
CURRENTLY MARRIED
88.6/ 100
METRIC RATING
121st/ 347
METRIC RANK
46.9%
CURRENTLY MARRIED
66.4/ 100
METRIC RATING
159th/ 347
METRIC RANK
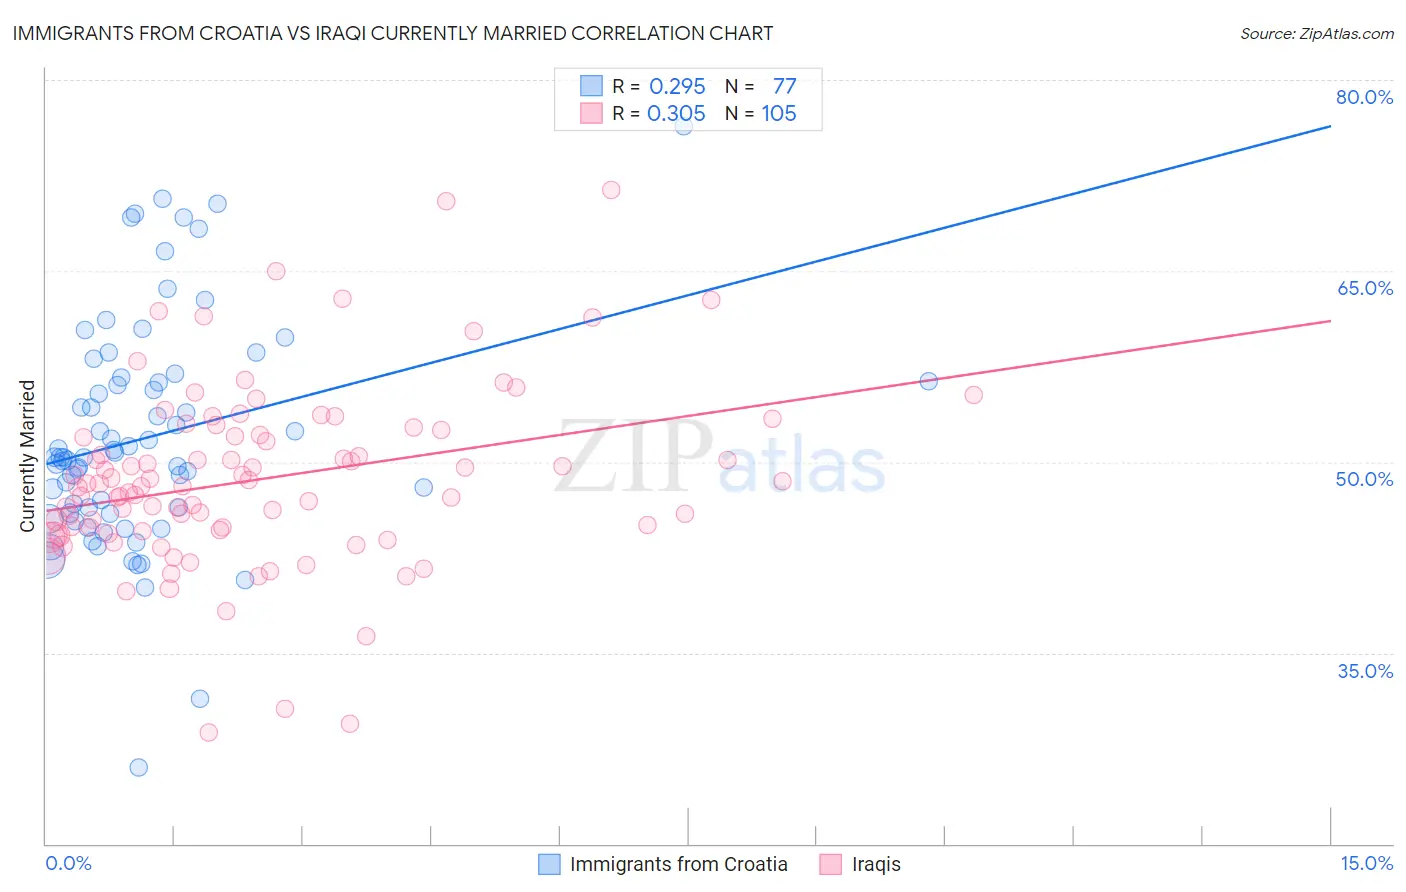
Immigrants from Croatia vs Iraqi Currently Married Correlation Chart
The statistical analysis conducted on geographies consisting of 132,574,468 people shows a weak positive correlation between the proportion of Immigrants from Croatia and percentage of population currently married in the United States with a correlation coefficient (R) of 0.295 and weighted average of 47.5%. Similarly, the statistical analysis conducted on geographies consisting of 170,656,152 people shows a mild positive correlation between the proportion of Iraqis and percentage of population currently married in the United States with a correlation coefficient (R) of 0.305 and weighted average of 46.9%, a difference of 1.3%.
Currently Married Correlation Summary
| Measurement | Immigrants from Croatia | Iraqi |
| Minimum | 26.0% | 28.7% |
| Maximum | 76.4% | 71.4% |
| Range | 50.4% | 42.7% |
| Mean | 51.9% | 48.7% |
| Median | 50.4% | 48.1% |
| Interquartile 25% (IQ1) | 45.9% | 44.6% |
| Interquartile 75% (IQ3) | 56.5% | 52.3% |
| Interquartile Range (IQR) | 10.5% | 7.7% |
| Standard Deviation (Sample) | 9.0% | 7.1% |
| Standard Deviation (Population) | 8.9% | 7.1% |
Similar Demographics by Currently Married
Demographics Similar to Immigrants from Croatia by Currently Married
In terms of currently married, the demographic groups most similar to Immigrants from Croatia are Syrian (47.5%, a difference of 0.030%), Osage (47.5%, a difference of 0.060%), Immigrants from Kazakhstan (47.4%, a difference of 0.12%), Immigrants from Philippines (47.6%, a difference of 0.15%), and Australian (47.6%, a difference of 0.15%).
| Demographics | Rating | Rank | Currently Married |
| South Africans | 90.5 /100 | #114 | Exceptional 47.6% |
| Immigrants | Indonesia | 90.5 /100 | #115 | Exceptional 47.6% |
| Palestinians | 90.4 /100 | #116 | Exceptional 47.6% |
| Puget Sound Salish | 90.3 /100 | #117 | Exceptional 47.6% |
| Immigrants | Philippines | 90.2 /100 | #118 | Exceptional 47.6% |
| Australians | 90.2 /100 | #119 | Exceptional 47.6% |
| Syrians | 88.9 /100 | #120 | Excellent 47.5% |
| Immigrants | Croatia | 88.6 /100 | #121 | Excellent 47.5% |
| Osage | 87.9 /100 | #122 | Excellent 47.5% |
| Immigrants | Kazakhstan | 87.2 /100 | #123 | Excellent 47.4% |
| Laotians | 86.6 /100 | #124 | Excellent 47.4% |
| Okinawans | 85.3 /100 | #125 | Excellent 47.4% |
| Immigrants | Jordan | 84.9 /100 | #126 | Excellent 47.4% |
| New Zealanders | 84.9 /100 | #127 | Excellent 47.4% |
| Portuguese | 84.2 /100 | #128 | Excellent 47.3% |
Demographics Similar to Iraqis by Currently Married
In terms of currently married, the demographic groups most similar to Iraqis are Cherokee (46.9%, a difference of 0.020%), Immigrants from Uzbekistan (46.9%, a difference of 0.020%), Immigrants from Southern Europe (46.9%, a difference of 0.020%), Nonimmigrants (46.9%, a difference of 0.040%), and Immigrants from Switzerland (46.9%, a difference of 0.060%).
| Demographics | Rating | Rank | Currently Married |
| Immigrants | Serbia | 68.8 /100 | #152 | Good 47.0% |
| Immigrants | Venezuela | 68.6 /100 | #153 | Good 47.0% |
| Albanians | 68.6 /100 | #154 | Good 47.0% |
| Arabs | 68.6 /100 | #155 | Good 47.0% |
| Spanish | 68.1 /100 | #156 | Good 47.0% |
| Immigrants | Switzerland | 67.8 /100 | #157 | Good 46.9% |
| Cherokee | 66.8 /100 | #158 | Good 46.9% |
| Iraqis | 66.4 /100 | #159 | Good 46.9% |
| Immigrants | Uzbekistan | 66.0 /100 | #160 | Good 46.9% |
| Immigrants | Southern Europe | 65.9 /100 | #161 | Good 46.9% |
| Immigrants | Nonimmigrants | 65.4 /100 | #162 | Good 46.9% |
| Delaware | 64.7 /100 | #163 | Good 46.9% |
| Immigrants | Western Asia | 64.2 /100 | #164 | Good 46.9% |
| Samoans | 59.8 /100 | #165 | Average 46.8% |
| Immigrants | Syria | 59.3 /100 | #166 | Average 46.8% |