Immigrants from Croatia vs Welsh Currently Married
COMPARE
Immigrants from Croatia
Welsh
Currently Married
Currently Married Comparison
Immigrants from Croatia
Welsh
47.5%
CURRENTLY MARRIED
88.6/ 100
METRIC RATING
121st/ 347
METRIC RANK
48.9%
CURRENTLY MARRIED
99.5/ 100
METRIC RATING
28th/ 347
METRIC RANK
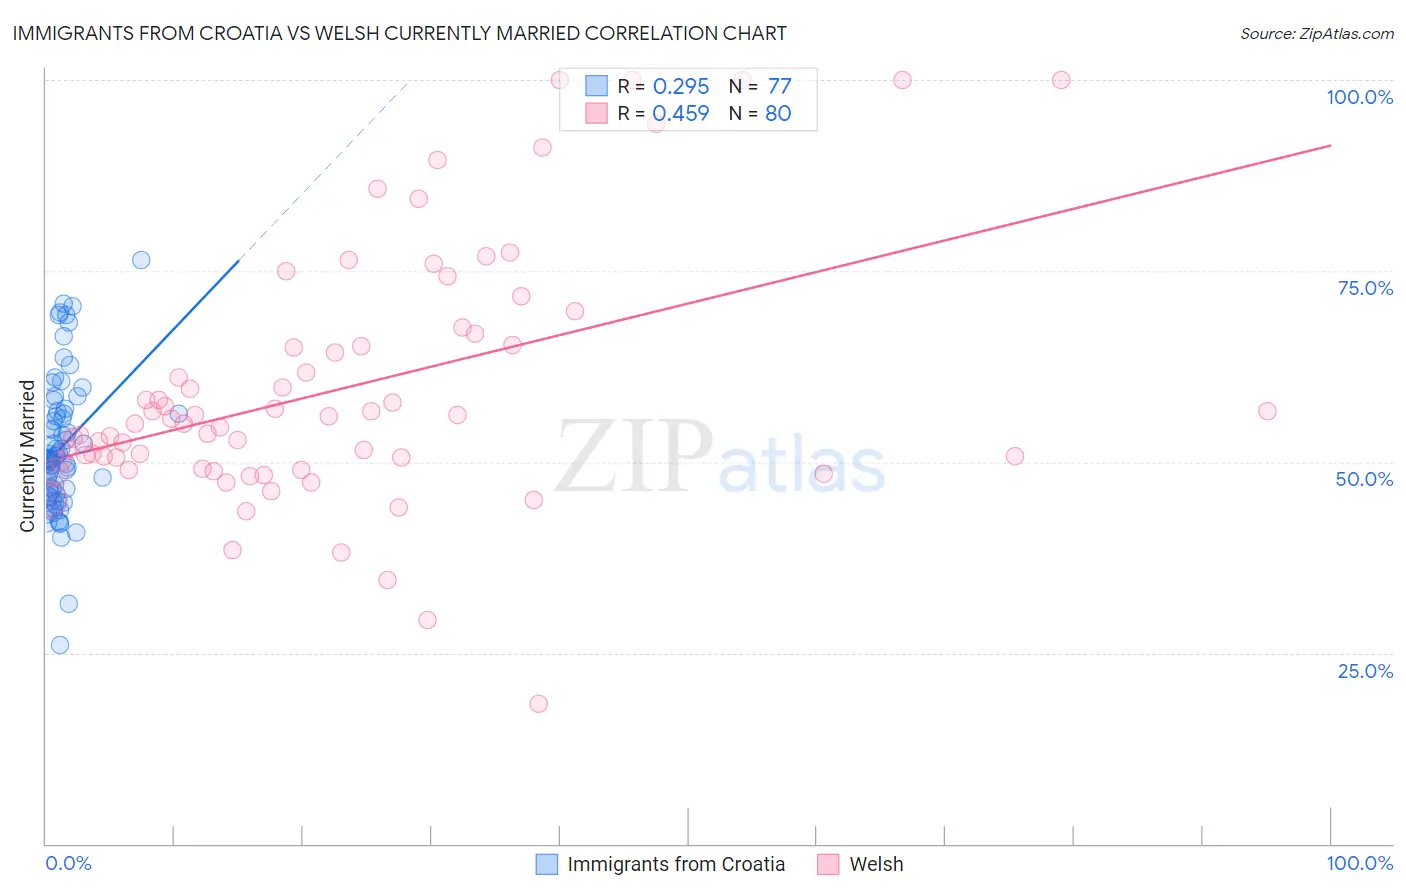
Immigrants from Croatia vs Welsh Currently Married Correlation Chart
The statistical analysis conducted on geographies consisting of 132,574,468 people shows a weak positive correlation between the proportion of Immigrants from Croatia and percentage of population currently married in the United States with a correlation coefficient (R) of 0.295 and weighted average of 47.5%. Similarly, the statistical analysis conducted on geographies consisting of 528,516,985 people shows a moderate positive correlation between the proportion of Welsh and percentage of population currently married in the United States with a correlation coefficient (R) of 0.459 and weighted average of 48.9%, a difference of 3.0%.
Currently Married Correlation Summary
| Measurement | Immigrants from Croatia | Welsh |
| Minimum | 26.0% | 18.4% |
| Maximum | 76.4% | 100.0% |
| Range | 50.4% | 81.6% |
| Mean | 51.9% | 59.7% |
| Median | 50.4% | 55.4% |
| Interquartile 25% (IQ1) | 45.9% | 49.6% |
| Interquartile 75% (IQ3) | 56.5% | 66.0% |
| Interquartile Range (IQR) | 10.5% | 16.4% |
| Standard Deviation (Sample) | 9.0% | 16.8% |
| Standard Deviation (Population) | 8.9% | 16.7% |
Similar Demographics by Currently Married
Demographics Similar to Immigrants from Croatia by Currently Married
In terms of currently married, the demographic groups most similar to Immigrants from Croatia are Syrian (47.5%, a difference of 0.030%), Osage (47.5%, a difference of 0.060%), Immigrants from Kazakhstan (47.4%, a difference of 0.12%), Immigrants from Philippines (47.6%, a difference of 0.15%), and Australian (47.6%, a difference of 0.15%).
| Demographics | Rating | Rank | Currently Married |
| South Africans | 90.5 /100 | #114 | Exceptional 47.6% |
| Immigrants | Indonesia | 90.5 /100 | #115 | Exceptional 47.6% |
| Palestinians | 90.4 /100 | #116 | Exceptional 47.6% |
| Puget Sound Salish | 90.3 /100 | #117 | Exceptional 47.6% |
| Immigrants | Philippines | 90.2 /100 | #118 | Exceptional 47.6% |
| Australians | 90.2 /100 | #119 | Exceptional 47.6% |
| Syrians | 88.9 /100 | #120 | Excellent 47.5% |
| Immigrants | Croatia | 88.6 /100 | #121 | Excellent 47.5% |
| Osage | 87.9 /100 | #122 | Excellent 47.5% |
| Immigrants | Kazakhstan | 87.2 /100 | #123 | Excellent 47.4% |
| Laotians | 86.6 /100 | #124 | Excellent 47.4% |
| Okinawans | 85.3 /100 | #125 | Excellent 47.4% |
| Immigrants | Jordan | 84.9 /100 | #126 | Excellent 47.4% |
| New Zealanders | 84.9 /100 | #127 | Excellent 47.4% |
| Portuguese | 84.2 /100 | #128 | Excellent 47.3% |
Demographics Similar to Welsh by Currently Married
In terms of currently married, the demographic groups most similar to Welsh are Burmese (48.9%, a difference of 0.040%), Croatian (48.9%, a difference of 0.050%), Eastern European (48.9%, a difference of 0.060%), Polish (48.9%, a difference of 0.060%), and Immigrants from Hong Kong (48.9%, a difference of 0.070%).
| Demographics | Rating | Rank | Currently Married |
| Scottish | 99.8 /100 | #21 | Exceptional 49.2% |
| Bulgarians | 99.7 /100 | #22 | Exceptional 49.1% |
| Immigrants | Pakistan | 99.7 /100 | #23 | Exceptional 49.1% |
| Lithuanians | 99.6 /100 | #24 | Exceptional 49.0% |
| Maltese | 99.6 /100 | #25 | Exceptional 49.0% |
| Immigrants | Korea | 99.6 /100 | #26 | Exceptional 49.0% |
| Burmese | 99.6 /100 | #27 | Exceptional 48.9% |
| Welsh | 99.5 /100 | #28 | Exceptional 48.9% |
| Croatians | 99.5 /100 | #29 | Exceptional 48.9% |
| Eastern Europeans | 99.5 /100 | #30 | Exceptional 48.9% |
| Poles | 99.5 /100 | #31 | Exceptional 48.9% |
| Immigrants | Hong Kong | 99.5 /100 | #32 | Exceptional 48.9% |
| Irish | 99.5 /100 | #33 | Exceptional 48.9% |
| Immigrants | Lithuania | 99.4 /100 | #34 | Exceptional 48.8% |
| Immigrants | Northern Europe | 99.4 /100 | #35 | Exceptional 48.8% |