Immigrants from Croatia vs British Married-couple Households
COMPARE
Immigrants from Croatia
British
Married-couple Households
Married-couple Households Comparison
Immigrants from Croatia
British
46.7%
MARRIED-COUPLE HOUSEHOLDS
64.2/ 100
METRIC RATING
167th/ 347
METRIC RANK
48.7%
MARRIED-COUPLE HOUSEHOLDS
99.5/ 100
METRIC RATING
47th/ 347
METRIC RANK
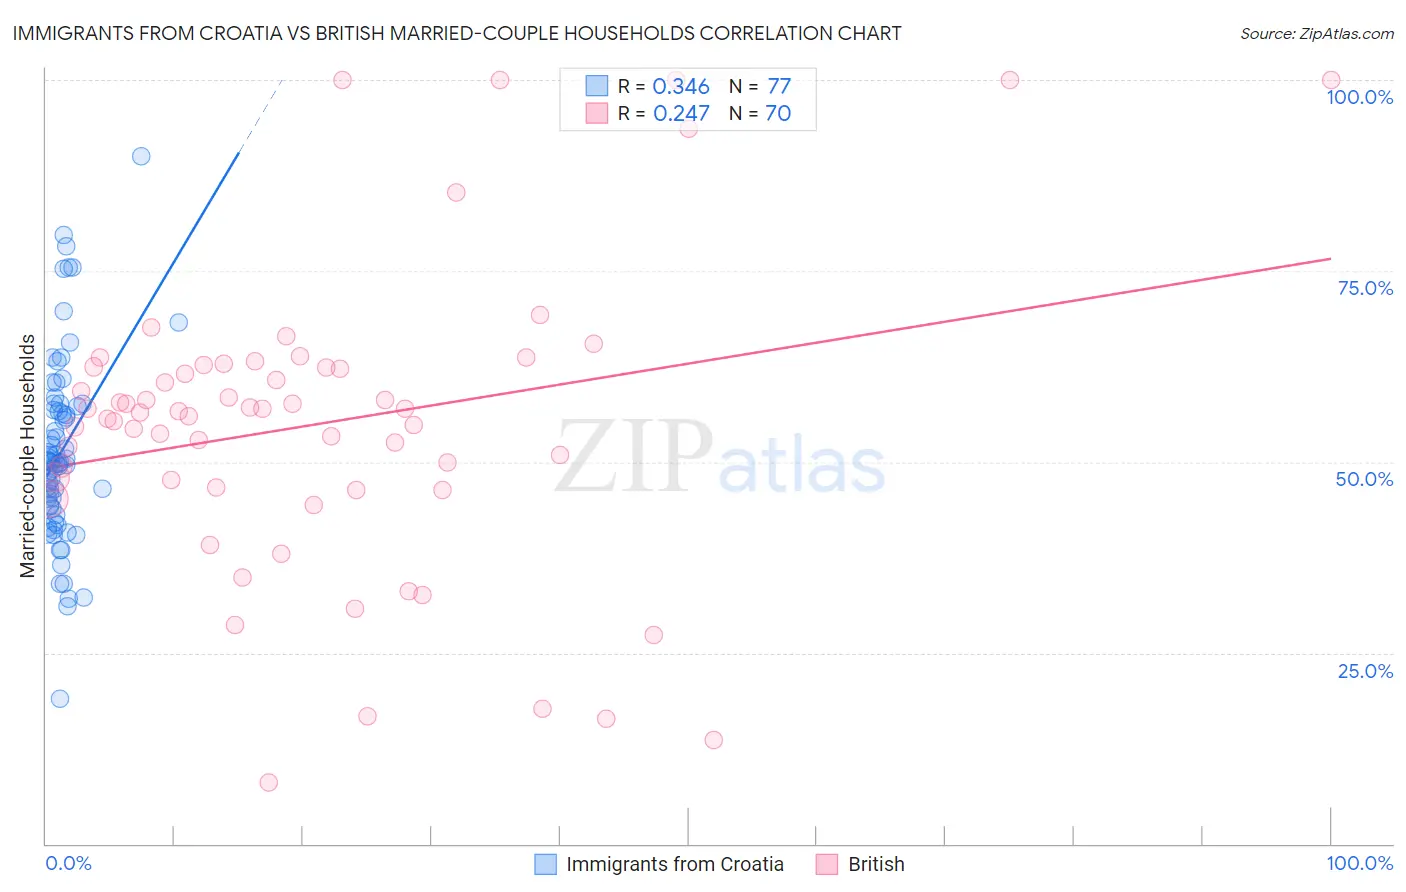
Immigrants from Croatia vs British Married-couple Households Correlation Chart
The statistical analysis conducted on geographies consisting of 132,566,764 people shows a mild positive correlation between the proportion of Immigrants from Croatia and percentage of married-couple family households in the United States with a correlation coefficient (R) of 0.346 and weighted average of 46.7%. Similarly, the statistical analysis conducted on geographies consisting of 530,976,365 people shows a weak positive correlation between the proportion of British and percentage of married-couple family households in the United States with a correlation coefficient (R) of 0.247 and weighted average of 48.7%, a difference of 4.4%.
Married-couple Households Correlation Summary
| Measurement | Immigrants from Croatia | British |
| Minimum | 18.9% | 8.1% |
| Maximum | 90.0% | 100.0% |
| Range | 71.1% | 91.9% |
| Mean | 51.4% | 55.0% |
| Median | 50.0% | 56.5% |
| Interquartile 25% (IQ1) | 44.0% | 46.7% |
| Interquartile 75% (IQ3) | 57.4% | 62.4% |
| Interquartile Range (IQR) | 13.4% | 15.8% |
| Standard Deviation (Sample) | 12.2% | 19.7% |
| Standard Deviation (Population) | 12.1% | 19.6% |
Similar Demographics by Married-couple Households
Demographics Similar to Immigrants from Croatia by Married-couple Households
In terms of married-couple households, the demographic groups most similar to Immigrants from Croatia are Cherokee (46.7%, a difference of 0.060%), Israeli (46.7%, a difference of 0.080%), Spanish American Indian (46.6%, a difference of 0.19%), Immigrants from Kazakhstan (46.8%, a difference of 0.24%), and Immigrants from Southern Europe (46.8%, a difference of 0.24%).
| Demographics | Rating | Rank | Married-couple Households |
| Iraqis | 71.7 /100 | #160 | Good 46.9% |
| Delaware | 71.2 /100 | #161 | Good 46.8% |
| Colombians | 71.0 /100 | #162 | Good 46.8% |
| Immigrants | Turkey | 70.2 /100 | #163 | Good 46.8% |
| Immigrants | Kazakhstan | 70.0 /100 | #164 | Good 46.8% |
| Immigrants | Southern Europe | 69.9 /100 | #165 | Good 46.8% |
| Cherokee | 65.7 /100 | #166 | Good 46.7% |
| Immigrants | Croatia | 64.2 /100 | #167 | Good 46.7% |
| Israelis | 62.3 /100 | #168 | Good 46.7% |
| Spanish American Indians | 59.4 /100 | #169 | Average 46.6% |
| South Americans | 58.0 /100 | #170 | Average 46.6% |
| Immigrants | Chile | 55.7 /100 | #171 | Average 46.5% |
| Immigrants | Australia | 54.6 /100 | #172 | Average 46.5% |
| Immigrants | Norway | 52.0 /100 | #173 | Average 46.5% |
| Immigrants | Mexico | 50.0 /100 | #174 | Average 46.4% |
Demographics Similar to British by Married-couple Households
In terms of married-couple households, the demographic groups most similar to British are Tsimshian (48.7%, a difference of 0.020%), Indian (Asian) (48.7%, a difference of 0.050%), Immigrants from Eastern Asia (48.8%, a difference of 0.060%), Welsh (48.8%, a difference of 0.10%), and Immigrants from Sri Lanka (48.7%, a difference of 0.12%).
| Demographics | Rating | Rank | Married-couple Households |
| Immigrants | Bolivia | 99.6 /100 | #40 | Exceptional 48.9% |
| Immigrants | Lebanon | 99.6 /100 | #41 | Exceptional 48.9% |
| Immigrants | Vietnam | 99.6 /100 | #42 | Exceptional 48.8% |
| Immigrants | Iran | 99.6 /100 | #43 | Exceptional 48.8% |
| Welsh | 99.5 /100 | #44 | Exceptional 48.8% |
| Immigrants | Eastern Asia | 99.5 /100 | #45 | Exceptional 48.8% |
| Tsimshian | 99.5 /100 | #46 | Exceptional 48.7% |
| British | 99.5 /100 | #47 | Exceptional 48.7% |
| Indians (Asian) | 99.4 /100 | #48 | Exceptional 48.7% |
| Immigrants | Sri Lanka | 99.4 /100 | #49 | Exceptional 48.7% |
| Samoans | 99.4 /100 | #50 | Exceptional 48.7% |
| Eastern Europeans | 99.3 /100 | #51 | Exceptional 48.6% |
| Irish | 99.3 /100 | #52 | Exceptional 48.6% |
| Whites/Caucasians | 99.3 /100 | #53 | Exceptional 48.6% |
| Immigrants | Lithuania | 99.3 /100 | #54 | Exceptional 48.6% |