Immigrants from Croatia vs British Receiving Food Stamps
COMPARE
Immigrants from Croatia
British
Receiving Food Stamps
Receiving Food Stamps Comparison
Immigrants from Croatia
British
10.0%
RECEIVING FOOD STAMPS
98.7/ 100
METRIC RATING
76th/ 347
METRIC RANK
9.7%
RECEIVING FOOD STAMPS
99.2/ 100
METRIC RATING
59th/ 347
METRIC RANK
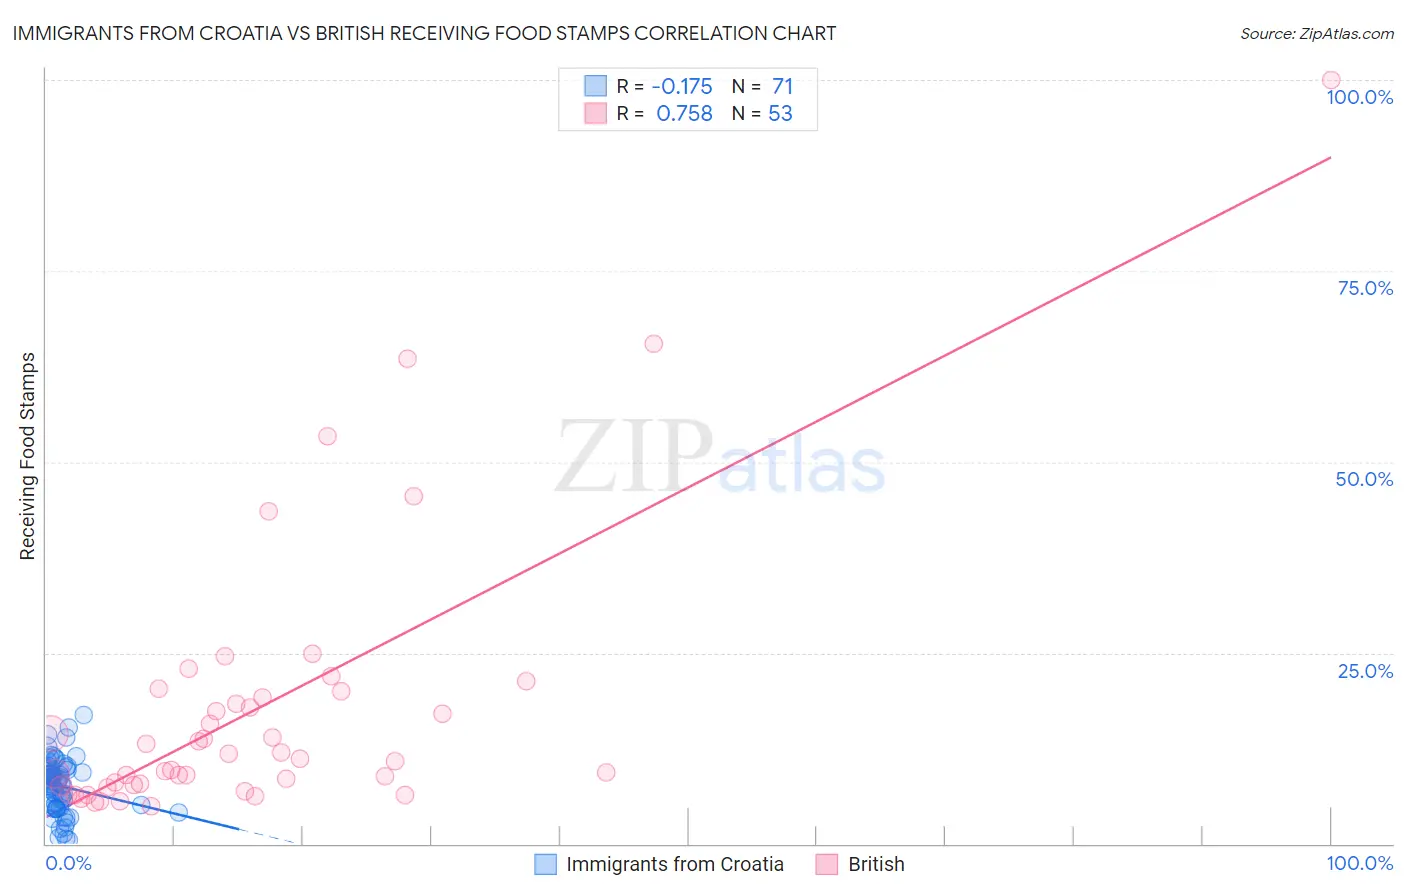
Immigrants from Croatia vs British Receiving Food Stamps Correlation Chart
The statistical analysis conducted on geographies consisting of 132,365,978 people shows a poor negative correlation between the proportion of Immigrants from Croatia and percentage of population receiving government assistance and/or food stamps in the United States with a correlation coefficient (R) of -0.175 and weighted average of 10.0%. Similarly, the statistical analysis conducted on geographies consisting of 528,917,419 people shows a strong positive correlation between the proportion of British and percentage of population receiving government assistance and/or food stamps in the United States with a correlation coefficient (R) of 0.758 and weighted average of 9.7%, a difference of 2.2%.
Receiving Food Stamps Correlation Summary
| Measurement | Immigrants from Croatia | British |
| Minimum | 0.50% | 4.9% |
| Maximum | 16.9% | 100.0% |
| Range | 16.4% | 95.1% |
| Mean | 7.6% | 17.6% |
| Median | 7.9% | 11.1% |
| Interquartile 25% (IQ1) | 4.7% | 7.6% |
| Interquartile 75% (IQ3) | 9.7% | 19.6% |
| Interquartile Range (IQR) | 5.0% | 12.0% |
| Standard Deviation (Sample) | 3.5% | 18.1% |
| Standard Deviation (Population) | 3.5% | 17.9% |
Demographics Similar to Immigrants from Croatia and British by Receiving Food Stamps
In terms of receiving food stamps, the demographic groups most similar to Immigrants from Croatia are Immigrants from Zimbabwe (9.9%, a difference of 0.010%), Immigrants from North Macedonia (10.0%, a difference of 0.080%), New Zealander (9.9%, a difference of 0.30%), Macedonian (9.9%, a difference of 0.47%), and Immigrants from Asia (9.9%, a difference of 0.53%). Similarly, the demographic groups most similar to British are Scandinavian (9.7%, a difference of 0.030%), Greek (9.7%, a difference of 0.090%), German (9.7%, a difference of 0.10%), English (9.8%, a difference of 0.24%), and Immigrants from Bulgaria (9.8%, a difference of 0.32%).
| Demographics | Rating | Rank | Receiving Food Stamps |
| Greeks | 99.3 /100 | #57 | Exceptional 9.7% |
| Scandinavians | 99.2 /100 | #58 | Exceptional 9.7% |
| British | 99.2 /100 | #59 | Exceptional 9.7% |
| Germans | 99.2 /100 | #60 | Exceptional 9.7% |
| English | 99.2 /100 | #61 | Exceptional 9.8% |
| Immigrants | Bulgaria | 99.2 /100 | #62 | Exceptional 9.8% |
| Chinese | 99.2 /100 | #63 | Exceptional 9.8% |
| Immigrants | North America | 99.2 /100 | #64 | Exceptional 9.8% |
| Immigrants | Turkey | 99.1 /100 | #65 | Exceptional 9.8% |
| Slovenes | 99.1 /100 | #66 | Exceptional 9.8% |
| Immigrants | Indonesia | 99.0 /100 | #67 | Exceptional 9.8% |
| Northern Europeans | 99.0 /100 | #68 | Exceptional 9.8% |
| Italians | 99.0 /100 | #69 | Exceptional 9.9% |
| Immigrants | Serbia | 99.0 /100 | #70 | Exceptional 9.9% |
| Scottish | 98.9 /100 | #71 | Exceptional 9.9% |
| Immigrants | Asia | 98.9 /100 | #72 | Exceptional 9.9% |
| Macedonians | 98.9 /100 | #73 | Exceptional 9.9% |
| New Zealanders | 98.8 /100 | #74 | Exceptional 9.9% |
| Immigrants | Zimbabwe | 98.7 /100 | #75 | Exceptional 9.9% |
| Immigrants | Croatia | 98.7 /100 | #76 | Exceptional 10.0% |
| Immigrants | North Macedonia | 98.7 /100 | #77 | Exceptional 10.0% |