Immigrants from Croatia vs American Married-couple Households
COMPARE
Immigrants from Croatia
American
Married-couple Households
Married-couple Households Comparison
Immigrants from Croatia
Americans
46.7%
MARRIED-COUPLE HOUSEHOLDS
64.2/ 100
METRIC RATING
167th/ 347
METRIC RANK
47.9%
MARRIED-COUPLE HOUSEHOLDS
96.9/ 100
METRIC RATING
94th/ 347
METRIC RANK
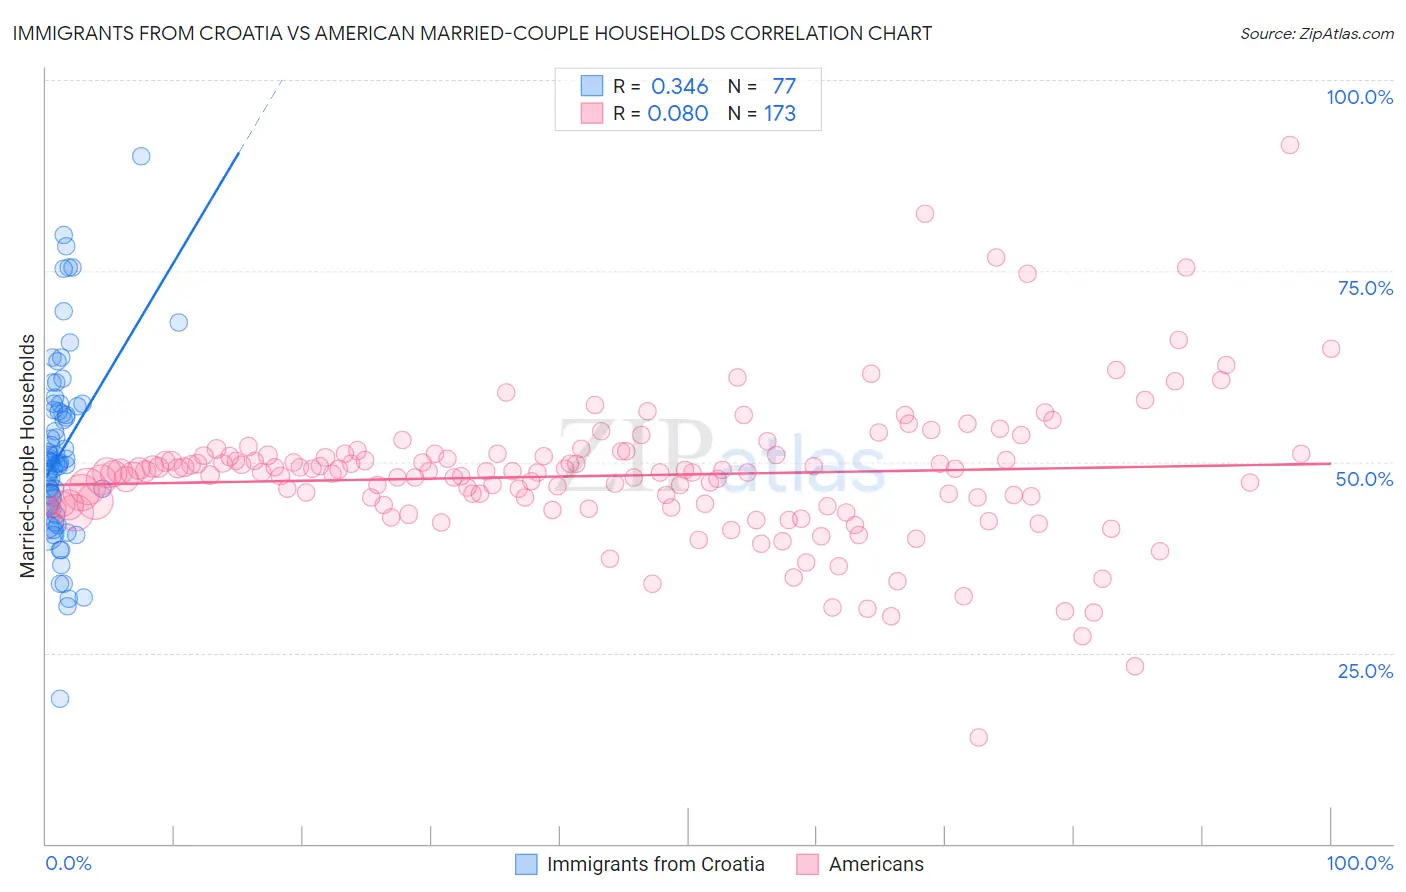
Immigrants from Croatia vs American Married-couple Households Correlation Chart
The statistical analysis conducted on geographies consisting of 132,566,764 people shows a mild positive correlation between the proportion of Immigrants from Croatia and percentage of married-couple family households in the United States with a correlation coefficient (R) of 0.346 and weighted average of 46.7%. Similarly, the statistical analysis conducted on geographies consisting of 581,345,567 people shows a slight positive correlation between the proportion of Americans and percentage of married-couple family households in the United States with a correlation coefficient (R) of 0.080 and weighted average of 47.9%, a difference of 2.7%.
Married-couple Households Correlation Summary
| Measurement | Immigrants from Croatia | American |
| Minimum | 18.9% | 14.0% |
| Maximum | 90.0% | 91.6% |
| Range | 71.1% | 77.6% |
| Mean | 51.4% | 48.2% |
| Median | 50.0% | 48.6% |
| Interquartile 25% (IQ1) | 44.0% | 44.4% |
| Interquartile 75% (IQ3) | 57.4% | 50.8% |
| Interquartile Range (IQR) | 13.4% | 6.4% |
| Standard Deviation (Sample) | 12.2% | 9.2% |
| Standard Deviation (Population) | 12.1% | 9.2% |
Similar Demographics by Married-couple Households
Demographics Similar to Immigrants from Croatia by Married-couple Households
In terms of married-couple households, the demographic groups most similar to Immigrants from Croatia are Cherokee (46.7%, a difference of 0.060%), Israeli (46.7%, a difference of 0.080%), Spanish American Indian (46.6%, a difference of 0.19%), Immigrants from Kazakhstan (46.8%, a difference of 0.24%), and Immigrants from Southern Europe (46.8%, a difference of 0.24%).
| Demographics | Rating | Rank | Married-couple Households |
| Iraqis | 71.7 /100 | #160 | Good 46.9% |
| Delaware | 71.2 /100 | #161 | Good 46.8% |
| Colombians | 71.0 /100 | #162 | Good 46.8% |
| Immigrants | Turkey | 70.2 /100 | #163 | Good 46.8% |
| Immigrants | Kazakhstan | 70.0 /100 | #164 | Good 46.8% |
| Immigrants | Southern Europe | 69.9 /100 | #165 | Good 46.8% |
| Cherokee | 65.7 /100 | #166 | Good 46.7% |
| Immigrants | Croatia | 64.2 /100 | #167 | Good 46.7% |
| Israelis | 62.3 /100 | #168 | Good 46.7% |
| Spanish American Indians | 59.4 /100 | #169 | Average 46.6% |
| South Americans | 58.0 /100 | #170 | Average 46.6% |
| Immigrants | Chile | 55.7 /100 | #171 | Average 46.5% |
| Immigrants | Australia | 54.6 /100 | #172 | Average 46.5% |
| Immigrants | Norway | 52.0 /100 | #173 | Average 46.5% |
| Immigrants | Mexico | 50.0 /100 | #174 | Average 46.4% |
Demographics Similar to Americans by Married-couple Households
In terms of married-couple households, the demographic groups most similar to Americans are Lebanese (47.9%, a difference of 0.0%), Palestinian (48.0%, a difference of 0.020%), Immigrants from Belgium (47.9%, a difference of 0.030%), Immigrants from Moldova (48.0%, a difference of 0.040%), and Immigrants from Egypt (47.9%, a difference of 0.080%).
| Demographics | Rating | Rank | Married-couple Households |
| Immigrants | Ireland | 97.3 /100 | #87 | Exceptional 48.0% |
| Afghans | 97.3 /100 | #88 | Exceptional 48.0% |
| Cypriots | 97.2 /100 | #89 | Exceptional 48.0% |
| French | 97.2 /100 | #90 | Exceptional 48.0% |
| Immigrants | Moldova | 97.0 /100 | #91 | Exceptional 48.0% |
| Palestinians | 96.9 /100 | #92 | Exceptional 48.0% |
| Lebanese | 96.9 /100 | #93 | Exceptional 47.9% |
| Americans | 96.9 /100 | #94 | Exceptional 47.9% |
| Immigrants | Belgium | 96.8 /100 | #95 | Exceptional 47.9% |
| Immigrants | Egypt | 96.6 /100 | #96 | Exceptional 47.9% |
| Latvians | 96.5 /100 | #97 | Exceptional 47.9% |
| Immigrants | North Macedonia | 96.4 /100 | #98 | Exceptional 47.9% |
| Immigrants | Austria | 96.4 /100 | #99 | Exceptional 47.9% |
| Immigrants | Italy | 96.3 /100 | #100 | Exceptional 47.9% |
| Turks | 96.1 /100 | #101 | Exceptional 47.8% |