Immigrants from Liberia vs American Married-couple Households
COMPARE
Immigrants from Liberia
American
Married-couple Households
Married-couple Households Comparison
Immigrants from Liberia
Americans
40.3%
MARRIED-COUPLE HOUSEHOLDS
0.0/ 100
METRIC RATING
321st/ 347
METRIC RANK
47.9%
MARRIED-COUPLE HOUSEHOLDS
96.9/ 100
METRIC RATING
94th/ 347
METRIC RANK
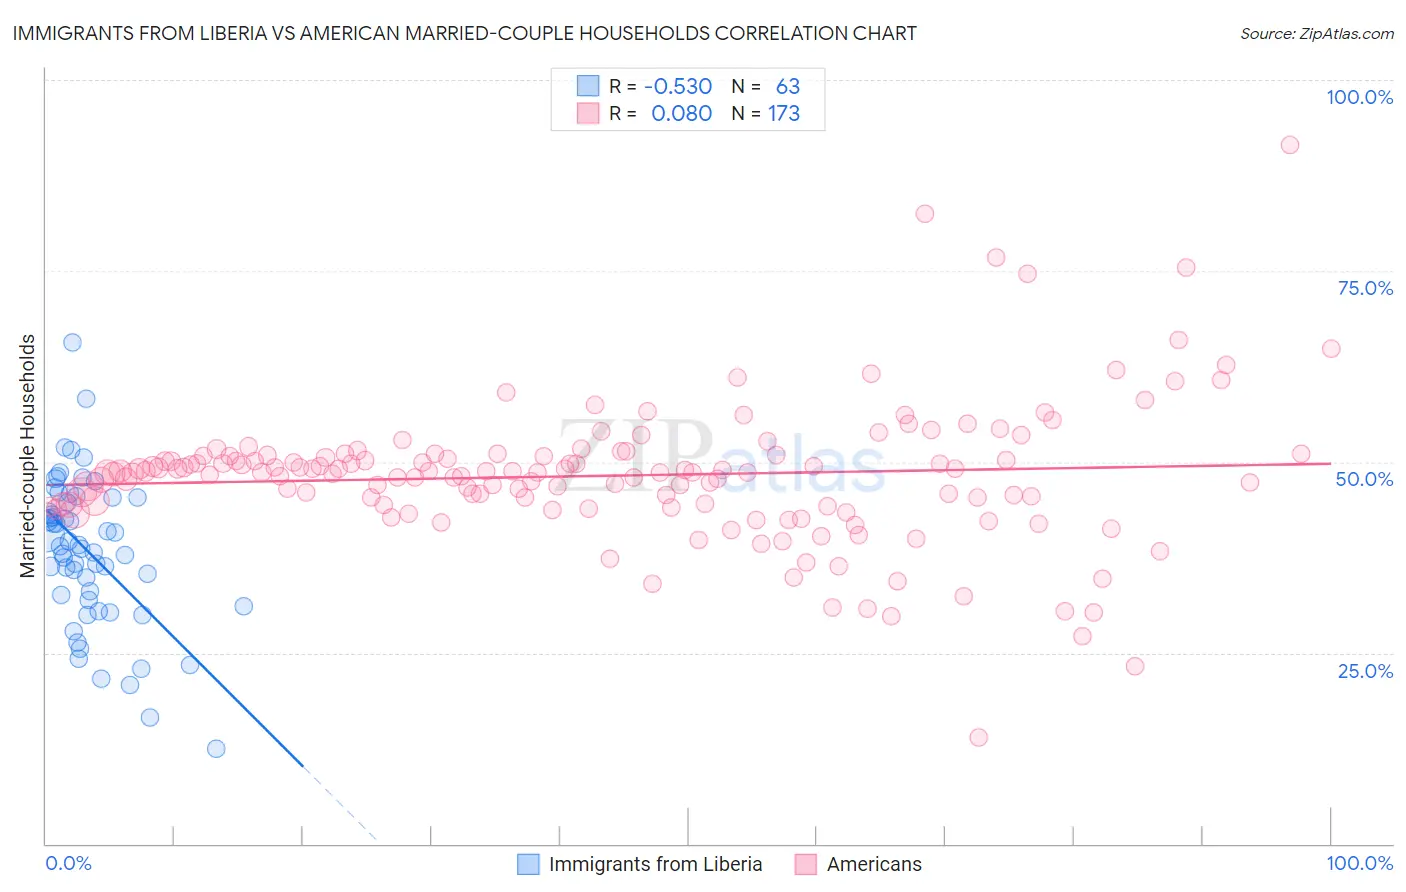
Immigrants from Liberia vs American Married-couple Households Correlation Chart
The statistical analysis conducted on geographies consisting of 135,232,319 people shows a substantial negative correlation between the proportion of Immigrants from Liberia and percentage of married-couple family households in the United States with a correlation coefficient (R) of -0.530 and weighted average of 40.3%. Similarly, the statistical analysis conducted on geographies consisting of 581,345,567 people shows a slight positive correlation between the proportion of Americans and percentage of married-couple family households in the United States with a correlation coefficient (R) of 0.080 and weighted average of 47.9%, a difference of 18.9%.
Married-couple Households Correlation Summary
| Measurement | Immigrants from Liberia | American |
| Minimum | 12.5% | 14.0% |
| Maximum | 65.7% | 91.6% |
| Range | 53.2% | 77.6% |
| Mean | 38.2% | 48.2% |
| Median | 39.0% | 48.6% |
| Interquartile 25% (IQ1) | 32.0% | 44.4% |
| Interquartile 75% (IQ3) | 45.3% | 50.8% |
| Interquartile Range (IQR) | 13.3% | 6.4% |
| Standard Deviation (Sample) | 9.8% | 9.2% |
| Standard Deviation (Population) | 9.7% | 9.2% |
Similar Demographics by Married-couple Households
Demographics Similar to Immigrants from Liberia by Married-couple Households
In terms of married-couple households, the demographic groups most similar to Immigrants from Liberia are West Indian (40.3%, a difference of 0.040%), Bahamian (40.5%, a difference of 0.45%), Immigrants from Zaire (40.1%, a difference of 0.66%), Puerto Rican (40.1%, a difference of 0.66%), and Navajo (40.1%, a difference of 0.67%).
| Demographics | Rating | Rank | Married-couple Households |
| Jamaicans | 0.0 /100 | #314 | Tragic 40.9% |
| Trinidadians and Tobagonians | 0.0 /100 | #315 | Tragic 40.9% |
| Immigrants | Caribbean | 0.0 /100 | #316 | Tragic 40.8% |
| Immigrants | Jamaica | 0.0 /100 | #317 | Tragic 40.7% |
| Liberians | 0.0 /100 | #318 | Tragic 40.7% |
| Bahamians | 0.0 /100 | #319 | Tragic 40.5% |
| West Indians | 0.0 /100 | #320 | Tragic 40.3% |
| Immigrants | Liberia | 0.0 /100 | #321 | Tragic 40.3% |
| Immigrants | Zaire | 0.0 /100 | #322 | Tragic 40.1% |
| Puerto Ricans | 0.0 /100 | #323 | Tragic 40.1% |
| Navajo | 0.0 /100 | #324 | Tragic 40.1% |
| Pueblo | 0.0 /100 | #325 | Tragic 40.0% |
| U.S. Virgin Islanders | 0.0 /100 | #326 | Tragic 39.8% |
| Lumbee | 0.0 /100 | #327 | Tragic 39.6% |
| Barbadians | 0.0 /100 | #328 | Tragic 39.4% |
Demographics Similar to Americans by Married-couple Households
In terms of married-couple households, the demographic groups most similar to Americans are Lebanese (47.9%, a difference of 0.0%), Palestinian (48.0%, a difference of 0.020%), Immigrants from Belgium (47.9%, a difference of 0.030%), Immigrants from Moldova (48.0%, a difference of 0.040%), and Immigrants from Egypt (47.9%, a difference of 0.080%).
| Demographics | Rating | Rank | Married-couple Households |
| Immigrants | Ireland | 97.3 /100 | #87 | Exceptional 48.0% |
| Afghans | 97.3 /100 | #88 | Exceptional 48.0% |
| Cypriots | 97.2 /100 | #89 | Exceptional 48.0% |
| French | 97.2 /100 | #90 | Exceptional 48.0% |
| Immigrants | Moldova | 97.0 /100 | #91 | Exceptional 48.0% |
| Palestinians | 96.9 /100 | #92 | Exceptional 48.0% |
| Lebanese | 96.9 /100 | #93 | Exceptional 47.9% |
| Americans | 96.9 /100 | #94 | Exceptional 47.9% |
| Immigrants | Belgium | 96.8 /100 | #95 | Exceptional 47.9% |
| Immigrants | Egypt | 96.6 /100 | #96 | Exceptional 47.9% |
| Latvians | 96.5 /100 | #97 | Exceptional 47.9% |
| Immigrants | North Macedonia | 96.4 /100 | #98 | Exceptional 47.9% |
| Immigrants | Austria | 96.4 /100 | #99 | Exceptional 47.9% |
| Immigrants | Italy | 96.3 /100 | #100 | Exceptional 47.9% |
| Turks | 96.1 /100 | #101 | Exceptional 47.8% |