Immigrants from Congo vs Immigrants from Sierra Leone Births to Unmarried Women
COMPARE
Immigrants from Congo
Immigrants from Sierra Leone
Births to Unmarried Women
Births to Unmarried Women Comparison
Immigrants from Congo
Immigrants from Sierra Leone
36.8%
BIRTHS TO UNMARRIED WOMEN
0.1/ 100
METRIC RATING
270th/ 347
METRIC RANK
34.2%
BIRTHS TO UNMARRIED WOMEN
3.1/ 100
METRIC RATING
229th/ 347
METRIC RANK
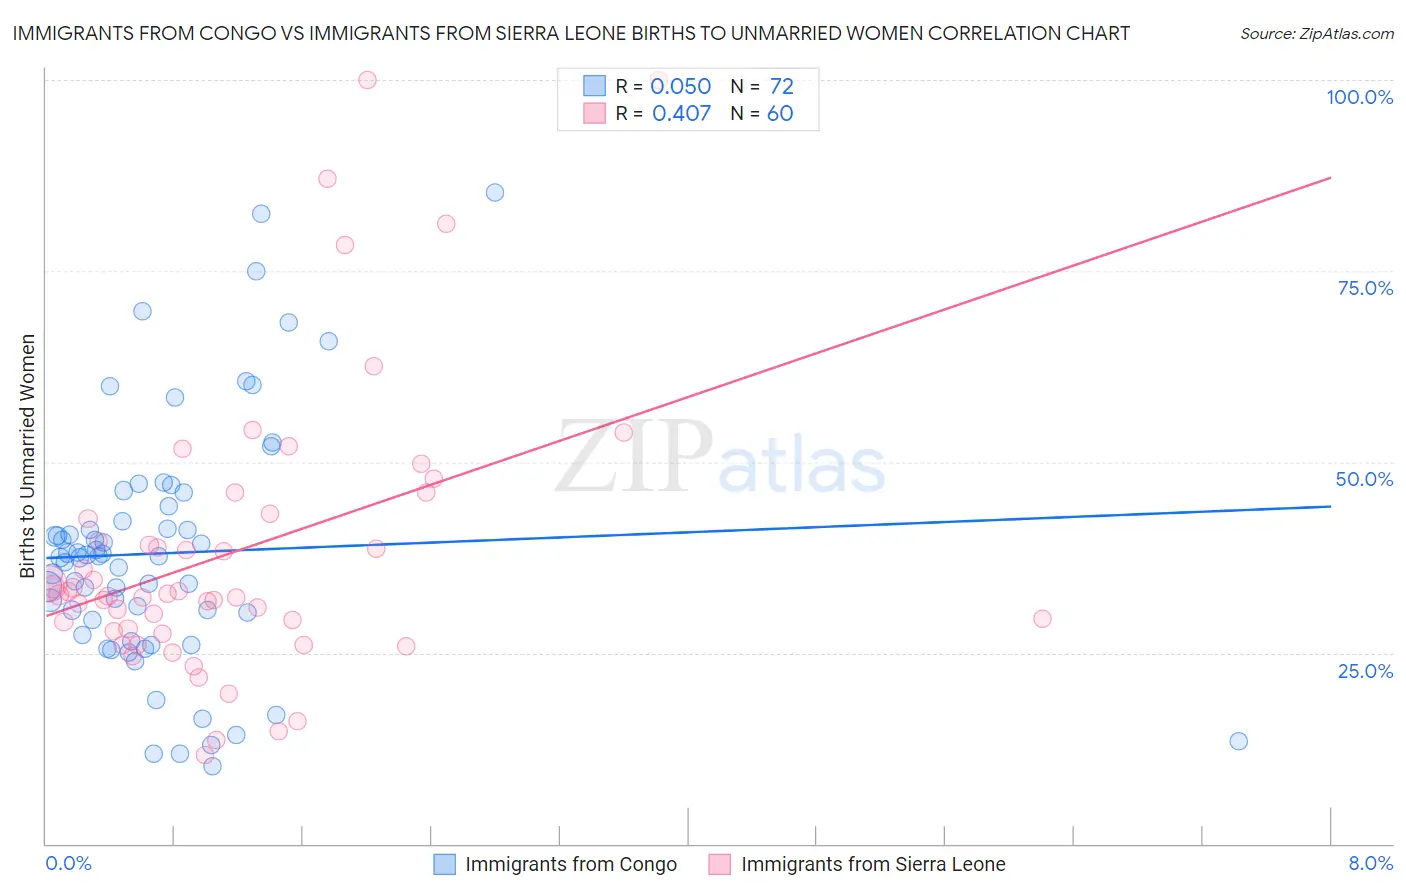
Immigrants from Congo vs Immigrants from Sierra Leone Births to Unmarried Women Correlation Chart
The statistical analysis conducted on geographies consisting of 91,138,649 people shows no correlation between the proportion of Immigrants from Congo and percentage of births to unmarried women in the United States with a correlation coefficient (R) of 0.050 and weighted average of 36.8%. Similarly, the statistical analysis conducted on geographies consisting of 99,540,756 people shows a moderate positive correlation between the proportion of Immigrants from Sierra Leone and percentage of births to unmarried women in the United States with a correlation coefficient (R) of 0.407 and weighted average of 34.2%, a difference of 7.4%.
Births to Unmarried Women Correlation Summary
| Measurement | Immigrants from Congo | Immigrants from Sierra Leone |
| Minimum | 10.2% | 11.7% |
| Maximum | 85.3% | 100.0% |
| Range | 75.1% | 88.3% |
| Mean | 38.0% | 38.2% |
| Median | 37.5% | 32.6% |
| Interquartile 25% (IQ1) | 28.3% | 28.0% |
| Interquartile 75% (IQ3) | 43.2% | 42.9% |
| Interquartile Range (IQR) | 14.9% | 14.9% |
| Standard Deviation (Sample) | 16.0% | 18.7% |
| Standard Deviation (Population) | 15.9% | 18.6% |
Similar Demographics by Births to Unmarried Women
Demographics Similar to Immigrants from Congo by Births to Unmarried Women
In terms of births to unmarried women, the demographic groups most similar to Immigrants from Congo are Immigrants from Barbados (36.8%, a difference of 0.030%), Senegalese (36.8%, a difference of 0.080%), Comanche (36.7%, a difference of 0.20%), Central American (36.7%, a difference of 0.21%), and Choctaw (36.9%, a difference of 0.24%).
| Demographics | Rating | Rank | Births to Unmarried Women |
| Nicaraguans | 0.1 /100 | #263 | Tragic 36.6% |
| Sub-Saharan Africans | 0.1 /100 | #264 | Tragic 36.7% |
| Cherokee | 0.1 /100 | #265 | Tragic 36.7% |
| Immigrants | Senegal | 0.1 /100 | #266 | Tragic 36.7% |
| Central Americans | 0.1 /100 | #267 | Tragic 36.7% |
| Comanche | 0.1 /100 | #268 | Tragic 36.7% |
| Senegalese | 0.1 /100 | #269 | Tragic 36.8% |
| Immigrants | Congo | 0.1 /100 | #270 | Tragic 36.8% |
| Immigrants | Barbados | 0.1 /100 | #271 | Tragic 36.8% |
| Choctaw | 0.1 /100 | #272 | Tragic 36.9% |
| Mexicans | 0.1 /100 | #273 | Tragic 36.9% |
| Cree | 0.1 /100 | #274 | Tragic 37.0% |
| Barbadians | 0.1 /100 | #275 | Tragic 37.0% |
| Belizeans | 0.1 /100 | #276 | Tragic 37.0% |
| Guatemalans | 0.1 /100 | #277 | Tragic 37.1% |
Demographics Similar to Immigrants from Sierra Leone by Births to Unmarried Women
In terms of births to unmarried women, the demographic groups most similar to Immigrants from Sierra Leone are Ghanaian (34.3%, a difference of 0.020%), Panamanian (34.2%, a difference of 0.11%), Immigrants from Panama (34.2%, a difference of 0.14%), Delaware (34.2%, a difference of 0.16%), and Native Hawaiian (34.3%, a difference of 0.17%).
| Demographics | Rating | Rank | Births to Unmarried Women |
| Immigrants | Uruguay | 4.8 /100 | #222 | Tragic 33.9% |
| Pennsylvania Germans | 4.3 /100 | #223 | Tragic 34.0% |
| Immigrants | Laos | 4.3 /100 | #224 | Tragic 34.0% |
| Spanish | 4.0 /100 | #225 | Tragic 34.1% |
| Delaware | 3.3 /100 | #226 | Tragic 34.2% |
| Immigrants | Panama | 3.3 /100 | #227 | Tragic 34.2% |
| Panamanians | 3.3 /100 | #228 | Tragic 34.2% |
| Immigrants | Sierra Leone | 3.1 /100 | #229 | Tragic 34.2% |
| Ghanaians | 3.1 /100 | #230 | Tragic 34.3% |
| Native Hawaiians | 2.9 /100 | #231 | Tragic 34.3% |
| French Canadians | 2.5 /100 | #232 | Tragic 34.4% |
| Bangladeshis | 2.5 /100 | #233 | Tragic 34.4% |
| Immigrants | Zaire | 2.3 /100 | #234 | Tragic 34.5% |
| Immigrants | Ghana | 2.2 /100 | #235 | Tragic 34.5% |
| Immigrants | Cameroon | 1.6 /100 | #236 | Tragic 34.7% |