Immigrants from Central America vs Immigrants from Western Asia Single Father Households
COMPARE
Immigrants from Central America
Immigrants from Western Asia
Single Father Households
Single Father Households Comparison
Immigrants from Central America
Immigrants from Western Asia
3.0%
SINGLE FATHER HOUSEHOLDS
0.0/ 100
METRIC RATING
323rd/ 347
METRIC RANK
2.1%
SINGLE FATHER HOUSEHOLDS
99.8/ 100
METRIC RATING
66th/ 347
METRIC RANK
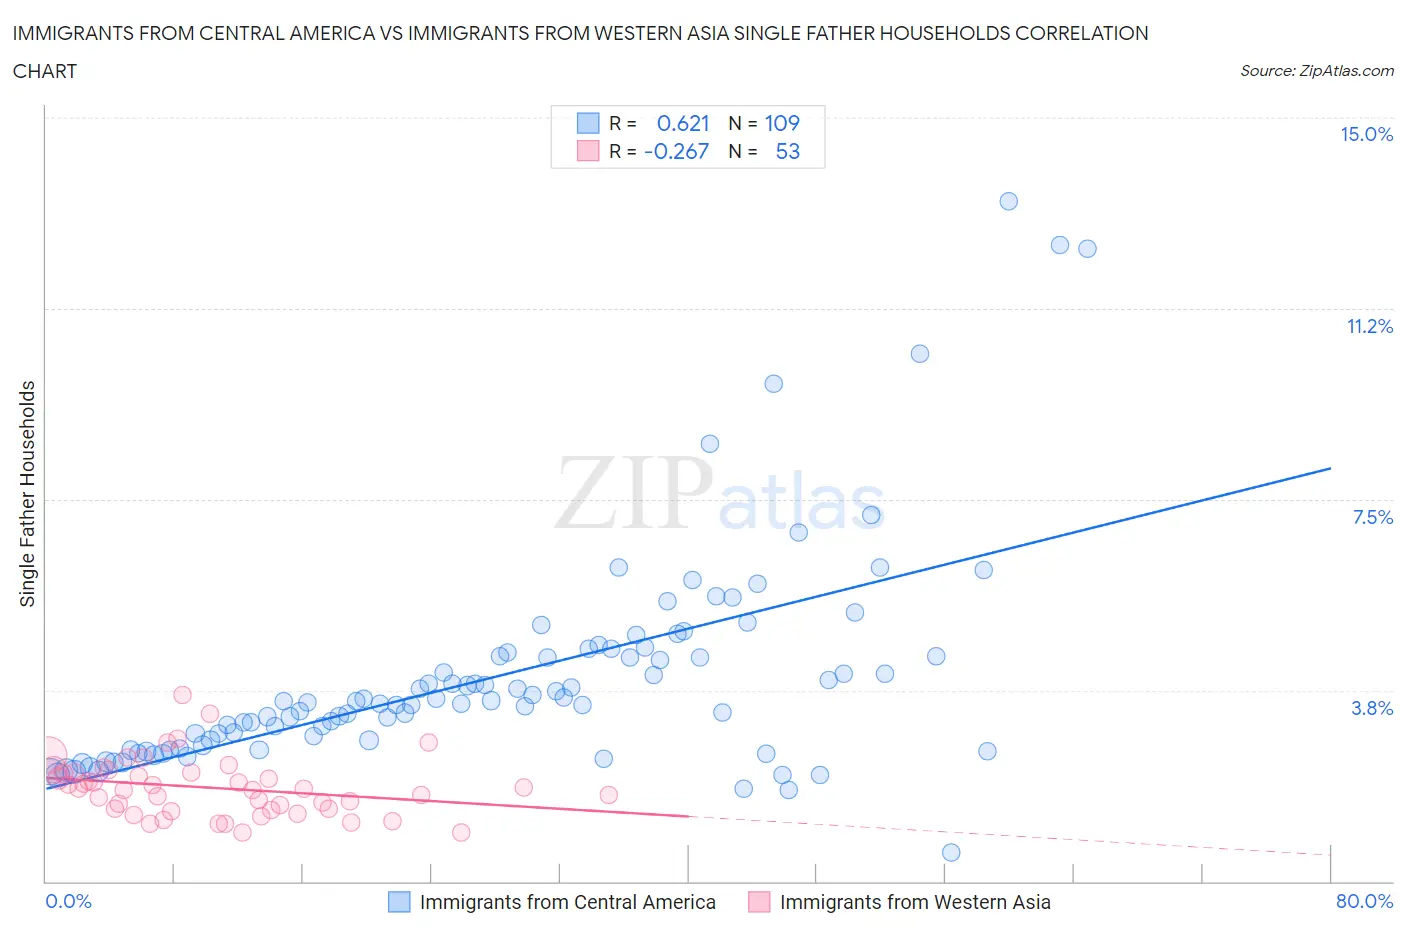
Immigrants from Central America vs Immigrants from Western Asia Single Father Households Correlation Chart
The statistical analysis conducted on geographies consisting of 526,445,722 people shows a significant positive correlation between the proportion of Immigrants from Central America and percentage of single father households in the United States with a correlation coefficient (R) of 0.621 and weighted average of 3.0%. Similarly, the statistical analysis conducted on geographies consisting of 400,712,229 people shows a weak negative correlation between the proportion of Immigrants from Western Asia and percentage of single father households in the United States with a correlation coefficient (R) of -0.267 and weighted average of 2.1%, a difference of 45.7%.
Single Father Households Correlation Summary
| Measurement | Immigrants from Central America | Immigrants from Western Asia |
| Minimum | 0.56% | 0.95% |
| Maximum | 13.4% | 3.6% |
| Range | 12.8% | 2.7% |
| Mean | 4.0% | 1.8% |
| Median | 3.5% | 1.8% |
| Interquartile 25% (IQ1) | 2.6% | 1.4% |
| Interquartile 75% (IQ3) | 4.5% | 2.1% |
| Interquartile Range (IQR) | 1.8% | 0.73% |
| Standard Deviation (Sample) | 2.1% | 0.56% |
| Standard Deviation (Population) | 2.1% | 0.56% |
Similar Demographics by Single Father Households
Demographics Similar to Immigrants from Central America by Single Father Households
In terms of single father households, the demographic groups most similar to Immigrants from Central America are Fijian (3.0%, a difference of 0.080%), Immigrants from Guatemala (3.0%, a difference of 0.31%), Mexican (3.0%, a difference of 0.84%), Guatemalan (3.0%, a difference of 1.2%), and Immigrants from Mexico (3.0%, a difference of 1.3%).
| Demographics | Rating | Rank | Single Father Households |
| Houma | 0.0 /100 | #316 | Tragic 2.9% |
| Immigrants | El Salvador | 0.0 /100 | #317 | Tragic 2.9% |
| Cape Verdeans | 0.0 /100 | #318 | Tragic 2.9% |
| Ute | 0.0 /100 | #319 | Tragic 3.0% |
| Guatemalans | 0.0 /100 | #320 | Tragic 3.0% |
| Mexicans | 0.0 /100 | #321 | Tragic 3.0% |
| Immigrants | Guatemala | 0.0 /100 | #322 | Tragic 3.0% |
| Immigrants | Central America | 0.0 /100 | #323 | Tragic 3.0% |
| Fijians | 0.0 /100 | #324 | Tragic 3.0% |
| Immigrants | Mexico | 0.0 /100 | #325 | Tragic 3.0% |
| Aleuts | 0.0 /100 | #326 | Tragic 3.0% |
| Bangladeshis | 0.0 /100 | #327 | Tragic 3.1% |
| Immigrants | Cabo Verde | 0.0 /100 | #328 | Tragic 3.1% |
| Chippewa | 0.0 /100 | #329 | Tragic 3.1% |
| Nepalese | 0.0 /100 | #330 | Tragic 3.1% |
Demographics Similar to Immigrants from Western Asia by Single Father Households
In terms of single father households, the demographic groups most similar to Immigrants from Western Asia are Immigrants from Italy (2.1%, a difference of 0.050%), Immigrants from Denmark (2.1%, a difference of 0.14%), Immigrants from Romania (2.1%, a difference of 0.16%), Paraguayan (2.1%, a difference of 0.36%), and Egyptian (2.1%, a difference of 0.37%).
| Demographics | Rating | Rank | Single Father Households |
| Immigrants | North Macedonia | 99.9 /100 | #59 | Exceptional 2.0% |
| Immigrants | Austria | 99.9 /100 | #60 | Exceptional 2.0% |
| Vietnamese | 99.9 /100 | #61 | Exceptional 2.0% |
| Immigrants | Malaysia | 99.9 /100 | #62 | Exceptional 2.0% |
| Maltese | 99.9 /100 | #63 | Exceptional 2.0% |
| Mongolians | 99.9 /100 | #64 | Exceptional 2.1% |
| Paraguayans | 99.9 /100 | #65 | Exceptional 2.1% |
| Immigrants | Western Asia | 99.8 /100 | #66 | Exceptional 2.1% |
| Immigrants | Italy | 99.8 /100 | #67 | Exceptional 2.1% |
| Immigrants | Denmark | 99.8 /100 | #68 | Exceptional 2.1% |
| Immigrants | Romania | 99.8 /100 | #69 | Exceptional 2.1% |
| Egyptians | 99.8 /100 | #70 | Exceptional 2.1% |
| Immigrants | Kuwait | 99.8 /100 | #71 | Exceptional 2.1% |
| Immigrants | Spain | 99.8 /100 | #72 | Exceptional 2.1% |
| Immigrants | Bangladesh | 99.8 /100 | #73 | Exceptional 2.1% |