Immigrants from Central America vs German Single Father Households
COMPARE
Immigrants from Central America
German
Single Father Households
Single Father Households Comparison
Immigrants from Central America
Germans
3.0%
SINGLE FATHER HOUSEHOLDS
0.0/ 100
METRIC RATING
323rd/ 347
METRIC RANK
2.4%
SINGLE FATHER HOUSEHOLDS
28.0/ 100
METRIC RATING
197th/ 347
METRIC RANK
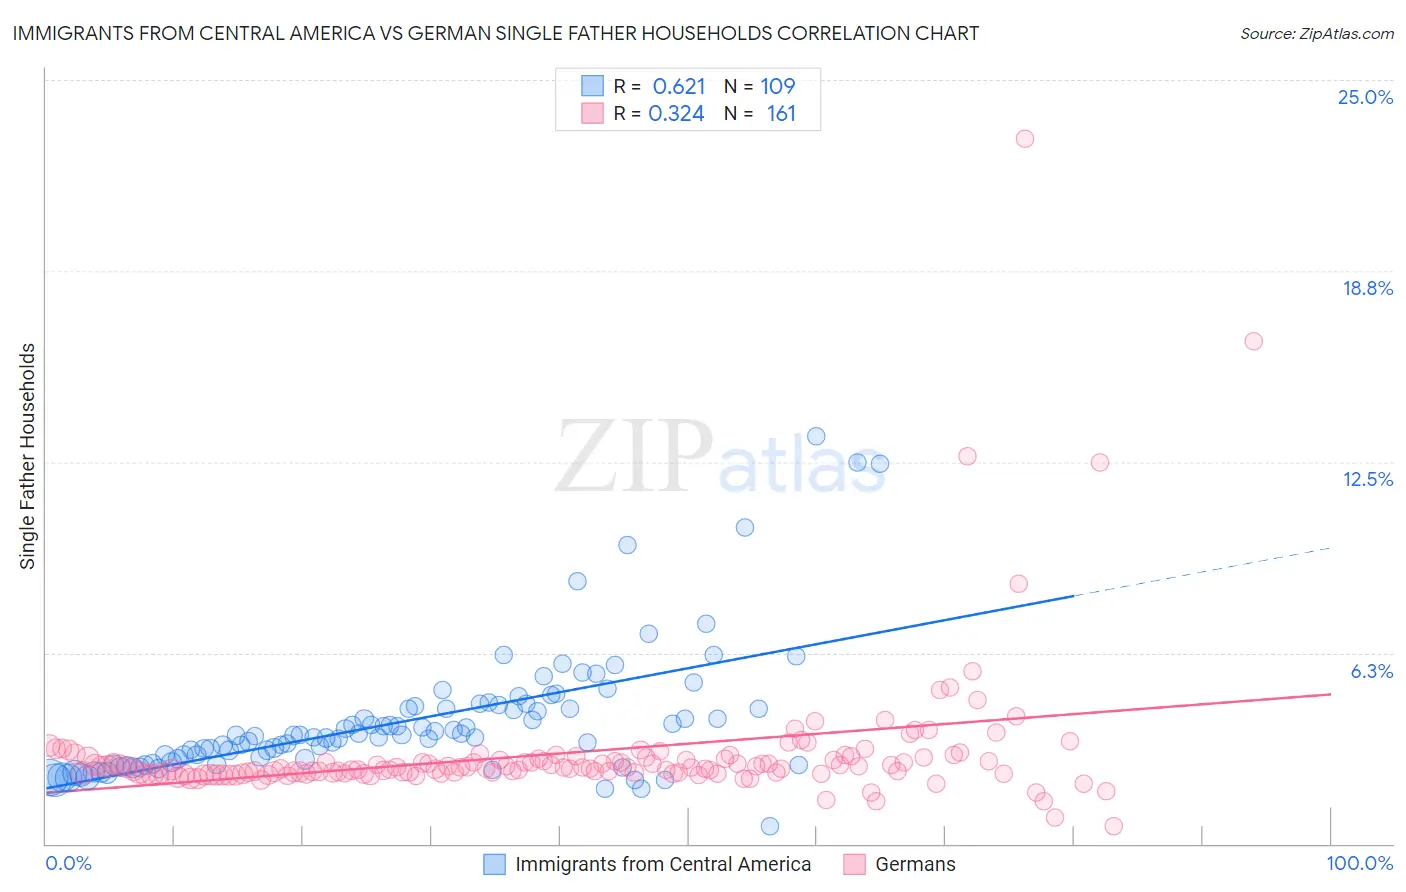
Immigrants from Central America vs German Single Father Households Correlation Chart
The statistical analysis conducted on geographies consisting of 526,445,722 people shows a significant positive correlation between the proportion of Immigrants from Central America and percentage of single father households in the United States with a correlation coefficient (R) of 0.621 and weighted average of 3.0%. Similarly, the statistical analysis conducted on geographies consisting of 562,897,212 people shows a mild positive correlation between the proportion of Germans and percentage of single father households in the United States with a correlation coefficient (R) of 0.324 and weighted average of 2.4%, a difference of 26.2%.
Single Father Households Correlation Summary
| Measurement | Immigrants from Central America | German |
| Minimum | 0.56% | 0.56% |
| Maximum | 13.4% | 23.1% |
| Range | 12.8% | 22.5% |
| Mean | 4.0% | 3.0% |
| Median | 3.5% | 2.5% |
| Interquartile 25% (IQ1) | 2.6% | 2.3% |
| Interquartile 75% (IQ3) | 4.5% | 2.8% |
| Interquartile Range (IQR) | 1.8% | 0.50% |
| Standard Deviation (Sample) | 2.1% | 2.4% |
| Standard Deviation (Population) | 2.1% | 2.3% |
Similar Demographics by Single Father Households
Demographics Similar to Immigrants from Central America by Single Father Households
In terms of single father households, the demographic groups most similar to Immigrants from Central America are Fijian (3.0%, a difference of 0.080%), Immigrants from Guatemala (3.0%, a difference of 0.31%), Mexican (3.0%, a difference of 0.84%), Guatemalan (3.0%, a difference of 1.2%), and Immigrants from Mexico (3.0%, a difference of 1.3%).
| Demographics | Rating | Rank | Single Father Households |
| Houma | 0.0 /100 | #316 | Tragic 2.9% |
| Immigrants | El Salvador | 0.0 /100 | #317 | Tragic 2.9% |
| Cape Verdeans | 0.0 /100 | #318 | Tragic 2.9% |
| Ute | 0.0 /100 | #319 | Tragic 3.0% |
| Guatemalans | 0.0 /100 | #320 | Tragic 3.0% |
| Mexicans | 0.0 /100 | #321 | Tragic 3.0% |
| Immigrants | Guatemala | 0.0 /100 | #322 | Tragic 3.0% |
| Immigrants | Central America | 0.0 /100 | #323 | Tragic 3.0% |
| Fijians | 0.0 /100 | #324 | Tragic 3.0% |
| Immigrants | Mexico | 0.0 /100 | #325 | Tragic 3.0% |
| Aleuts | 0.0 /100 | #326 | Tragic 3.0% |
| Bangladeshis | 0.0 /100 | #327 | Tragic 3.1% |
| Immigrants | Cabo Verde | 0.0 /100 | #328 | Tragic 3.1% |
| Chippewa | 0.0 /100 | #329 | Tragic 3.1% |
| Nepalese | 0.0 /100 | #330 | Tragic 3.1% |
Demographics Similar to Germans by Single Father Households
In terms of single father households, the demographic groups most similar to Germans are Kenyan (2.4%, a difference of 0.0%), Scandinavian (2.4%, a difference of 0.050%), Immigrants from Philippines (2.4%, a difference of 0.060%), Immigrants from Vietnam (2.4%, a difference of 0.080%), and Peruvian (2.4%, a difference of 0.080%).
| Demographics | Rating | Rank | Single Father Households |
| French | 31.7 /100 | #190 | Fair 2.4% |
| Immigrants | Africa | 30.0 /100 | #191 | Fair 2.4% |
| Immigrants | Sudan | 29.8 /100 | #192 | Fair 2.4% |
| Uruguayans | 29.7 /100 | #193 | Fair 2.4% |
| Panamanians | 29.6 /100 | #194 | Fair 2.4% |
| Immigrants | Philippines | 28.7 /100 | #195 | Fair 2.4% |
| Kenyans | 28.0 /100 | #196 | Fair 2.4% |
| Germans | 28.0 /100 | #197 | Fair 2.4% |
| Scandinavians | 27.4 /100 | #198 | Fair 2.4% |
| Immigrants | Vietnam | 27.1 /100 | #199 | Fair 2.4% |
| Peruvians | 27.1 /100 | #200 | Fair 2.4% |
| Immigrants | Uganda | 26.0 /100 | #201 | Fair 2.4% |
| German Russians | 25.7 /100 | #202 | Fair 2.4% |
| French Canadians | 24.7 /100 | #203 | Fair 2.4% |
| Ecuadorians | 24.5 /100 | #204 | Fair 2.4% |