Immigrants from Cambodia vs Shoshone Currently Married
COMPARE
Immigrants from Cambodia
Shoshone
Currently Married
Currently Married Comparison
Immigrants from Cambodia
Shoshone
44.5%
CURRENTLY MARRIED
0.7/ 100
METRIC RATING
242nd/ 347
METRIC RANK
44.0%
CURRENTLY MARRIED
0.2/ 100
METRIC RATING
256th/ 347
METRIC RANK
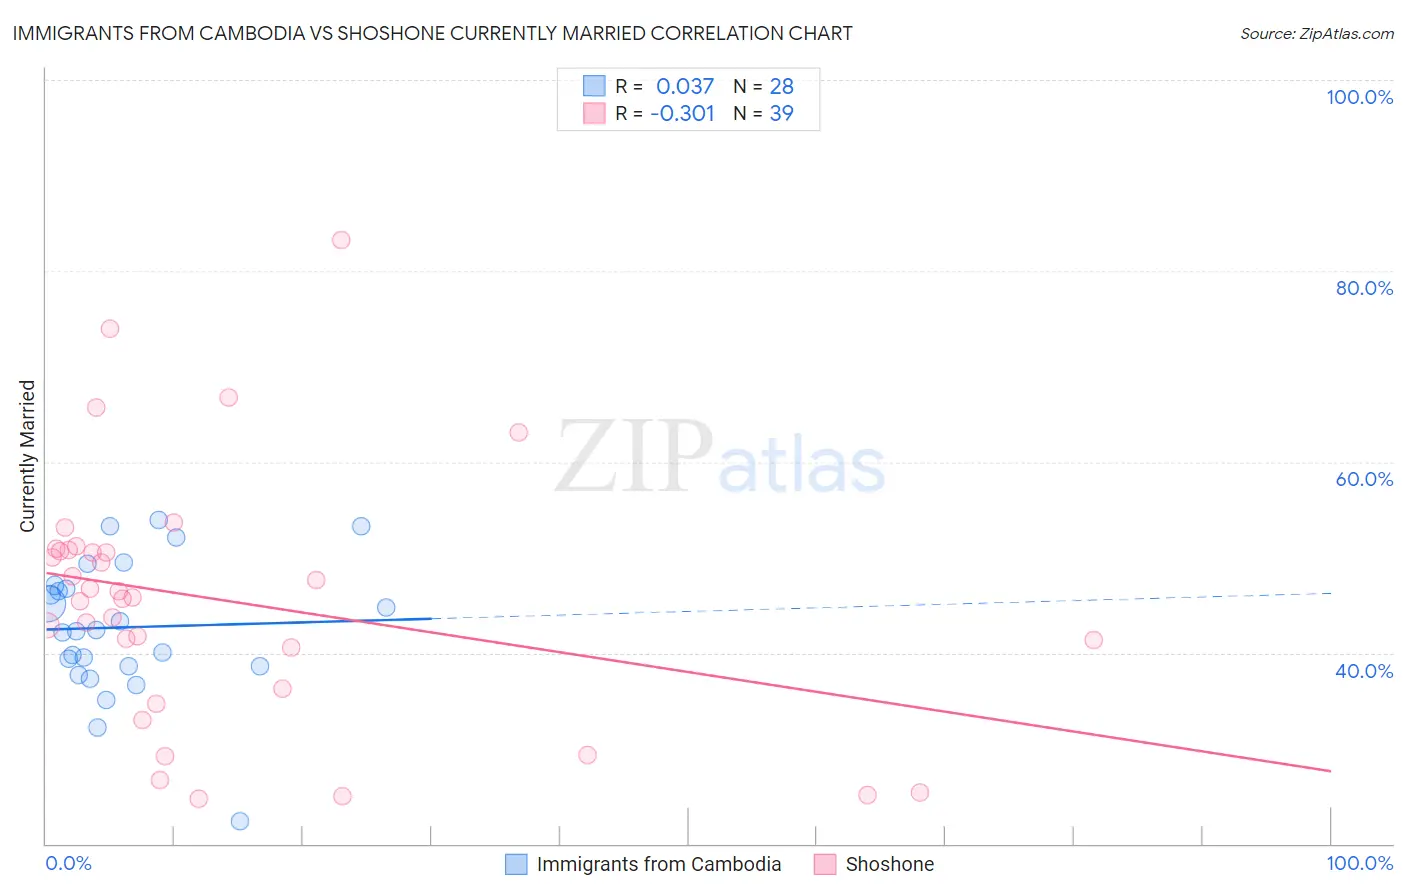
Immigrants from Cambodia vs Shoshone Currently Married Correlation Chart
The statistical analysis conducted on geographies consisting of 205,155,379 people shows no correlation between the proportion of Immigrants from Cambodia and percentage of population currently married in the United States with a correlation coefficient (R) of 0.037 and weighted average of 44.5%. Similarly, the statistical analysis conducted on geographies consisting of 66,627,152 people shows a mild negative correlation between the proportion of Shoshone and percentage of population currently married in the United States with a correlation coefficient (R) of -0.301 and weighted average of 44.0%, a difference of 1.2%.
Currently Married Correlation Summary
| Measurement | Immigrants from Cambodia | Shoshone |
| Minimum | 22.4% | 24.7% |
| Maximum | 53.9% | 83.3% |
| Range | 31.5% | 58.6% |
| Mean | 42.7% | 45.5% |
| Median | 42.3% | 45.8% |
| Interquartile 25% (IQ1) | 38.6% | 36.3% |
| Interquartile 75% (IQ3) | 46.9% | 50.8% |
| Interquartile Range (IQR) | 8.3% | 14.5% |
| Standard Deviation (Sample) | 7.1% | 13.3% |
| Standard Deviation (Population) | 6.9% | 13.2% |
Demographics Similar to Immigrants from Cambodia and Shoshone by Currently Married
In terms of currently married, the demographic groups most similar to Immigrants from Cambodia are Immigrants from Ethiopia (44.5%, a difference of 0.010%), Ethiopian (44.5%, a difference of 0.030%), Immigrants from Mexico (44.5%, a difference of 0.090%), Mexican American Indian (44.5%, a difference of 0.090%), and Japanese (44.5%, a difference of 0.090%). Similarly, the demographic groups most similar to Shoshone are Yakama (44.0%, a difference of 0.050%), Vietnamese (44.0%, a difference of 0.12%), Immigrants from Africa (43.9%, a difference of 0.20%), Ute (43.9%, a difference of 0.21%), and Immigrants from Central America (44.1%, a difference of 0.37%).
| Demographics | Rating | Rank | Currently Married |
| Immigrants | Mexico | 0.7 /100 | #239 | Tragic 44.5% |
| Mexican American Indians | 0.7 /100 | #240 | Tragic 44.5% |
| Ethiopians | 0.7 /100 | #241 | Tragic 44.5% |
| Immigrants | Cambodia | 0.7 /100 | #242 | Tragic 44.5% |
| Immigrants | Ethiopia | 0.7 /100 | #243 | Tragic 44.5% |
| Japanese | 0.6 /100 | #244 | Tragic 44.5% |
| Immigrants | Armenia | 0.4 /100 | #245 | Tragic 44.3% |
| Immigrants | Burma/Myanmar | 0.4 /100 | #246 | Tragic 44.3% |
| Ugandans | 0.4 /100 | #247 | Tragic 44.2% |
| Nicaraguans | 0.3 /100 | #248 | Tragic 44.2% |
| Immigrants | Cameroon | 0.3 /100 | #249 | Tragic 44.2% |
| Immigrants | Eastern Africa | 0.3 /100 | #250 | Tragic 44.2% |
| Blackfeet | 0.3 /100 | #251 | Tragic 44.2% |
| Hispanics or Latinos | 0.3 /100 | #252 | Tragic 44.1% |
| Immigrants | Central America | 0.3 /100 | #253 | Tragic 44.1% |
| Vietnamese | 0.2 /100 | #254 | Tragic 44.0% |
| Yakama | 0.2 /100 | #255 | Tragic 44.0% |
| Shoshone | 0.2 /100 | #256 | Tragic 44.0% |
| Immigrants | Africa | 0.2 /100 | #257 | Tragic 43.9% |
| Ute | 0.2 /100 | #258 | Tragic 43.9% |
| Immigrants | Sierra Leone | 0.1 /100 | #259 | Tragic 43.8% |