Immigrants from Cambodia vs Immigrants from Serbia Unemployment Among Women with Children Under 18 years
COMPARE
Immigrants from Cambodia
Immigrants from Serbia
Unemployment Among Women with Children Under 18 years
Unemployment Among Women with Children Under 18 years Comparison
Immigrants from Cambodia
Immigrants from Serbia
5.5%
UNEMPLOYMENT AMONG WOMEN WITH CHILDREN UNDER 18 YEARS
38.4/ 100
METRIC RATING
184th/ 347
METRIC RANK
5.1%
UNEMPLOYMENT AMONG WOMEN WITH CHILDREN UNDER 18 YEARS
98.2/ 100
METRIC RATING
54th/ 347
METRIC RANK
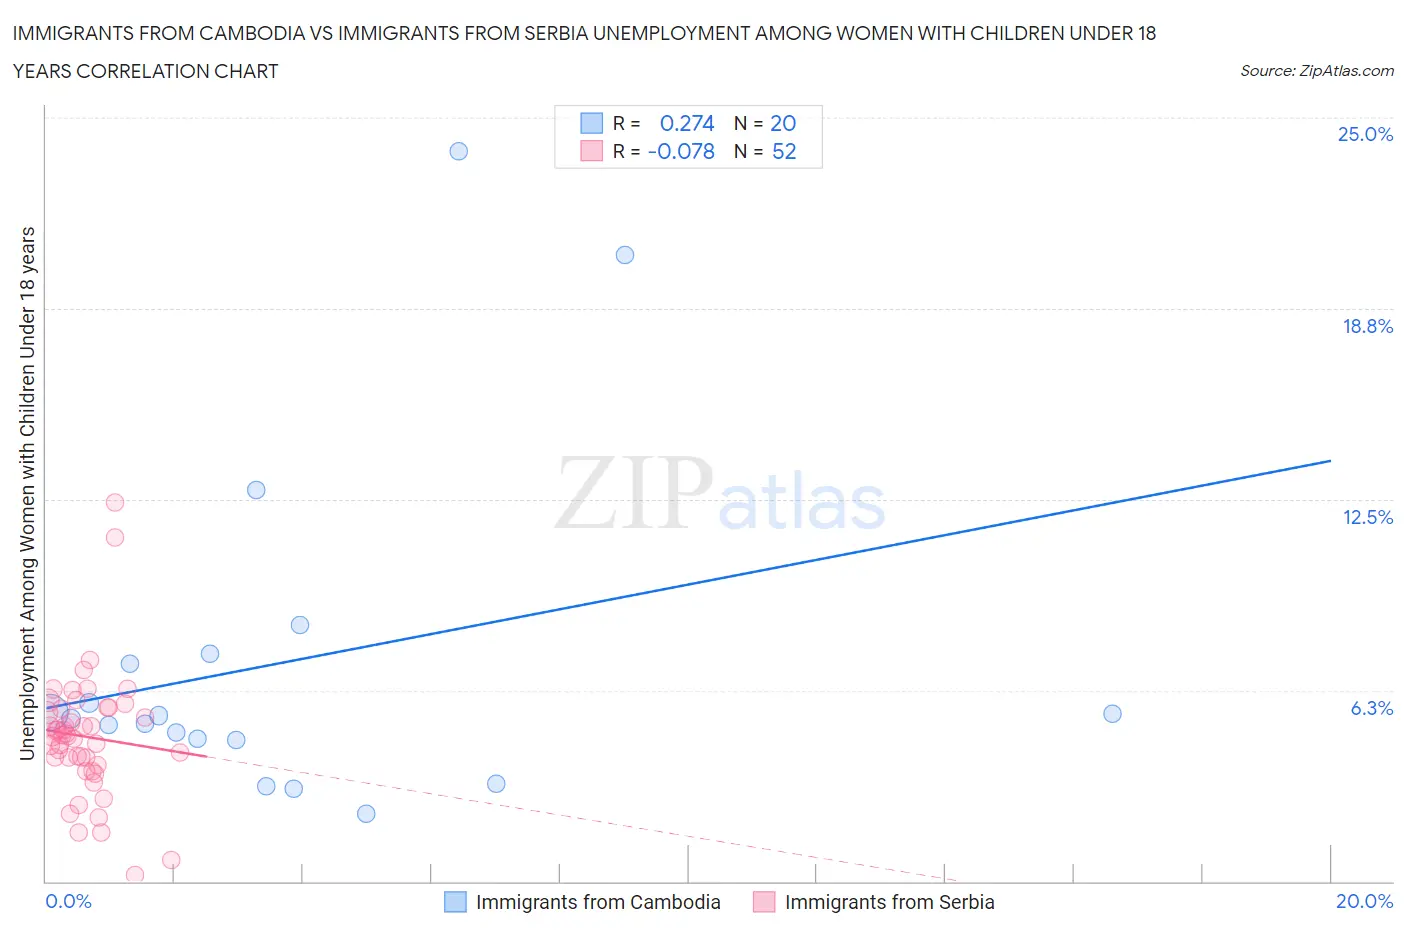
Immigrants from Cambodia vs Immigrants from Serbia Unemployment Among Women with Children Under 18 years Correlation Chart
The statistical analysis conducted on geographies consisting of 201,816,037 people shows a weak positive correlation between the proportion of Immigrants from Cambodia and unemployment rate among women with children under the age of 18 in the United States with a correlation coefficient (R) of 0.274 and weighted average of 5.5%. Similarly, the statistical analysis conducted on geographies consisting of 129,807,496 people shows a slight negative correlation between the proportion of Immigrants from Serbia and unemployment rate among women with children under the age of 18 in the United States with a correlation coefficient (R) of -0.078 and weighted average of 5.1%, a difference of 8.5%.
Unemployment Among Women with Children Under 18 years Correlation Summary
| Measurement | Immigrants from Cambodia | Immigrants from Serbia |
| Minimum | 2.2% | 0.20% |
| Maximum | 23.9% | 12.4% |
| Range | 21.7% | 12.2% |
| Mean | 7.2% | 4.7% |
| Median | 5.4% | 4.8% |
| Interquartile 25% (IQ1) | 4.7% | 3.9% |
| Interquartile 75% (IQ3) | 7.3% | 5.7% |
| Interquartile Range (IQR) | 2.6% | 1.8% |
| Standard Deviation (Sample) | 5.6% | 2.1% |
| Standard Deviation (Population) | 5.5% | 2.1% |
Similar Demographics by Unemployment Among Women with Children Under 18 years
Demographics Similar to Immigrants from Cambodia by Unemployment Among Women with Children Under 18 years
In terms of unemployment among women with children under 18 years, the demographic groups most similar to Immigrants from Cambodia are Immigrants from Zaire (5.5%, a difference of 0.020%), Immigrants from Laos (5.5%, a difference of 0.030%), Indonesian (5.5%, a difference of 0.15%), Immigrants from Sudan (5.5%, a difference of 0.16%), and Malaysian (5.5%, a difference of 0.21%).
| Demographics | Rating | Rank | Unemployment Among Women with Children Under 18 years |
| Hawaiians | 46.1 /100 | #177 | Average 5.5% |
| Costa Ricans | 45.2 /100 | #178 | Average 5.5% |
| Syrians | 42.8 /100 | #179 | Average 5.5% |
| Immigrants | Southern Europe | 42.7 /100 | #180 | Average 5.5% |
| Immigrants | Hungary | 41.3 /100 | #181 | Average 5.5% |
| Immigrants | Sudan | 40.6 /100 | #182 | Average 5.5% |
| Immigrants | Laos | 38.8 /100 | #183 | Fair 5.5% |
| Immigrants | Cambodia | 38.4 /100 | #184 | Fair 5.5% |
| Immigrants | Zaire | 38.1 /100 | #185 | Fair 5.5% |
| Indonesians | 36.3 /100 | #186 | Fair 5.5% |
| Malaysians | 35.7 /100 | #187 | Fair 5.5% |
| Iraqis | 35.3 /100 | #188 | Fair 5.5% |
| Immigrants | Eritrea | 33.8 /100 | #189 | Fair 5.5% |
| Immigrants | Poland | 31.2 /100 | #190 | Fair 5.5% |
| South American Indians | 30.8 /100 | #191 | Fair 5.5% |
Demographics Similar to Immigrants from Serbia by Unemployment Among Women with Children Under 18 years
In terms of unemployment among women with children under 18 years, the demographic groups most similar to Immigrants from Serbia are Scottish (5.1%, a difference of 0.030%), Yugoslavian (5.1%, a difference of 0.12%), Immigrants from Nepal (5.1%, a difference of 0.12%), Immigrants from Sri Lanka (5.1%, a difference of 0.13%), and Immigrants from Ireland (5.1%, a difference of 0.17%).
| Demographics | Rating | Rank | Unemployment Among Women with Children Under 18 years |
| British | 98.7 /100 | #47 | Exceptional 5.0% |
| Northern Europeans | 98.6 /100 | #48 | Exceptional 5.0% |
| Lithuanians | 98.4 /100 | #49 | Exceptional 5.0% |
| Immigrants | Japan | 98.4 /100 | #50 | Exceptional 5.0% |
| Yugoslavians | 98.3 /100 | #51 | Exceptional 5.1% |
| Immigrants | Nepal | 98.3 /100 | #52 | Exceptional 5.1% |
| Scottish | 98.2 /100 | #53 | Exceptional 5.1% |
| Immigrants | Serbia | 98.2 /100 | #54 | Exceptional 5.1% |
| Immigrants | Sri Lanka | 98.1 /100 | #55 | Exceptional 5.1% |
| Immigrants | Ireland | 98.0 /100 | #56 | Exceptional 5.1% |
| Czechoslovakians | 98.0 /100 | #57 | Exceptional 5.1% |
| Immigrants | Belgium | 97.9 /100 | #58 | Exceptional 5.1% |
| Asians | 97.9 /100 | #59 | Exceptional 5.1% |
| Welsh | 97.7 /100 | #60 | Exceptional 5.1% |
| Russians | 97.5 /100 | #61 | Exceptional 5.1% |