Immigrants from Burma/Myanmar vs Crow Single Father Households
COMPARE
Immigrants from Burma/Myanmar
Crow
Single Father Households
Single Father Households Comparison
Immigrants from Burma/Myanmar
Crow
2.4%
SINGLE FATHER HOUSEHOLDS
12.1/ 100
METRIC RATING
221st/ 347
METRIC RANK
3.5%
SINGLE FATHER HOUSEHOLDS
0.0/ 100
METRIC RATING
341st/ 347
METRIC RANK
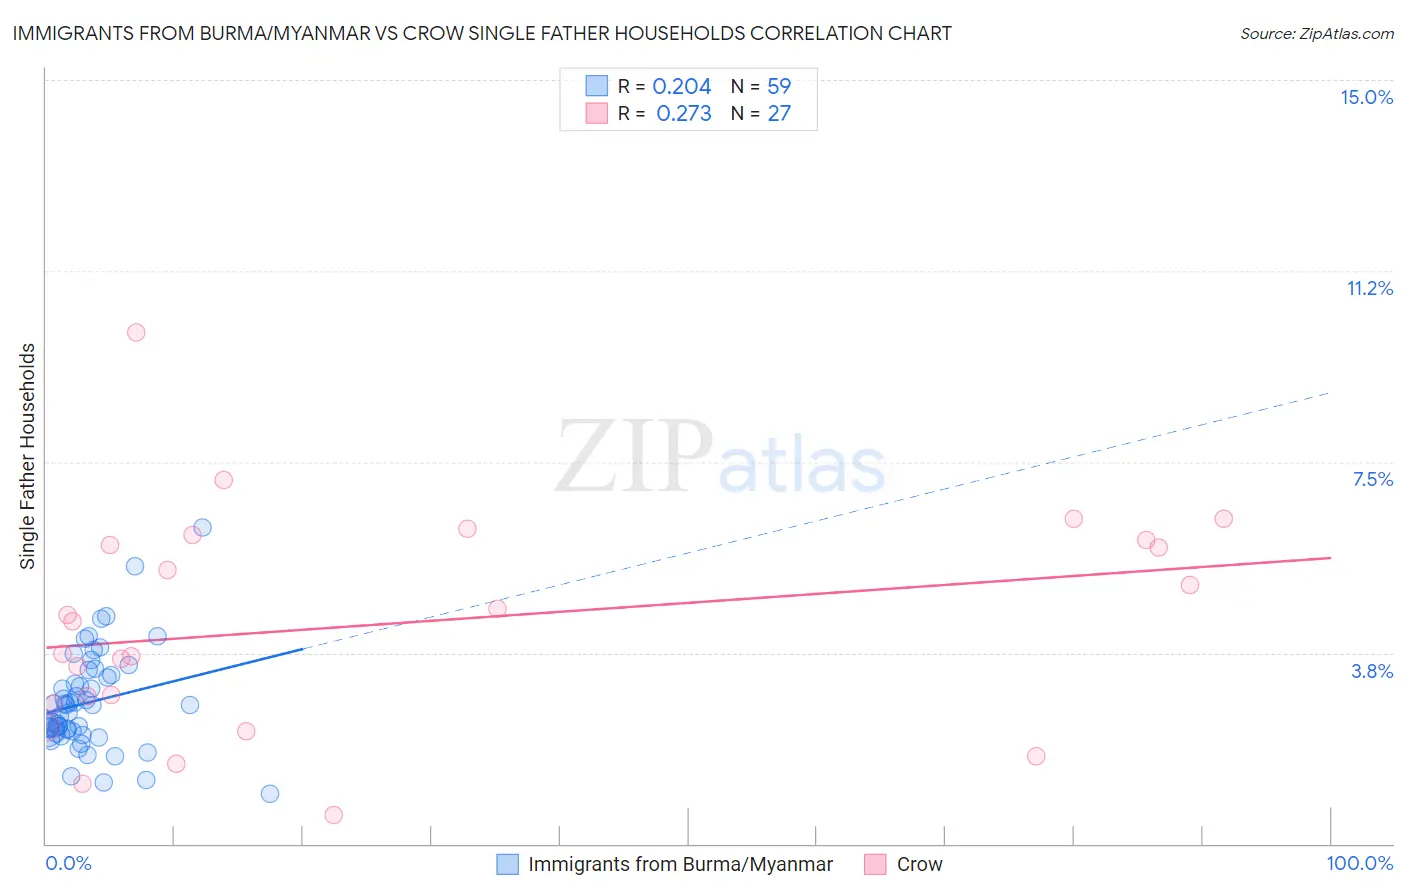
Immigrants from Burma/Myanmar vs Crow Single Father Households Correlation Chart
The statistical analysis conducted on geographies consisting of 171,785,459 people shows a weak positive correlation between the proportion of Immigrants from Burma/Myanmar and percentage of single father households in the United States with a correlation coefficient (R) of 0.204 and weighted average of 2.4%. Similarly, the statistical analysis conducted on geographies consisting of 59,051,704 people shows a weak positive correlation between the proportion of Crow and percentage of single father households in the United States with a correlation coefficient (R) of 0.273 and weighted average of 3.5%, a difference of 45.1%.
Single Father Households Correlation Summary
| Measurement | Immigrants from Burma/Myanmar | Crow |
| Minimum | 0.98% | 0.55% |
| Maximum | 6.2% | 10.0% |
| Range | 5.2% | 9.5% |
| Mean | 2.8% | 4.3% |
| Median | 2.7% | 4.4% |
| Interquartile 25% (IQ1) | 2.2% | 2.7% |
| Interquartile 75% (IQ3) | 3.3% | 6.0% |
| Interquartile Range (IQR) | 1.1% | 3.2% |
| Standard Deviation (Sample) | 0.98% | 2.1% |
| Standard Deviation (Population) | 0.97% | 2.1% |
Similar Demographics by Single Father Households
Demographics Similar to Immigrants from Burma/Myanmar by Single Father Households
In terms of single father households, the demographic groups most similar to Immigrants from Burma/Myanmar are Immigrants from Eastern Africa (2.4%, a difference of 0.030%), Ghanaian (2.4%, a difference of 0.13%), Sudanese (2.4%, a difference of 0.14%), Immigrants from Uruguay (2.4%, a difference of 0.19%), and Immigrants from Ethiopia (2.4%, a difference of 0.21%).
| Demographics | Rating | Rank | Single Father Households |
| Ethiopians | 16.6 /100 | #214 | Poor 2.4% |
| Immigrants | South Eastern Asia | 15.9 /100 | #215 | Poor 2.4% |
| Immigrants | Ecuador | 14.9 /100 | #216 | Poor 2.4% |
| Dutch | 14.3 /100 | #217 | Poor 2.4% |
| Immigrants | Ethiopia | 13.4 /100 | #218 | Poor 2.4% |
| Sudanese | 13.0 /100 | #219 | Poor 2.4% |
| Ghanaians | 12.9 /100 | #220 | Poor 2.4% |
| Immigrants | Burma/Myanmar | 12.1 /100 | #221 | Poor 2.4% |
| Immigrants | Eastern Africa | 11.9 /100 | #222 | Poor 2.4% |
| Immigrants | Uruguay | 11.0 /100 | #223 | Poor 2.4% |
| Immigrants | Bahamas | 10.6 /100 | #224 | Poor 2.4% |
| Marshallese | 9.7 /100 | #225 | Tragic 2.4% |
| Blacks/African Americans | 9.7 /100 | #226 | Tragic 2.4% |
| Americans | 9.3 /100 | #227 | Tragic 2.4% |
| Immigrants | Ghana | 9.1 /100 | #228 | Tragic 2.4% |
Demographics Similar to Crow by Single Father Households
In terms of single father households, the demographic groups most similar to Crow are Alaska Native (3.5%, a difference of 0.35%), Alaskan Athabascan (3.4%, a difference of 4.1%), Sioux (3.3%, a difference of 5.6%), Pueblo (3.3%, a difference of 6.4%), and Paiute (3.3%, a difference of 6.6%).
| Demographics | Rating | Rank | Single Father Households |
| Natives/Alaskans | 0.0 /100 | #333 | Tragic 3.2% |
| Yuman | 0.0 /100 | #334 | Tragic 3.3% |
| Colville | 0.0 /100 | #335 | Tragic 3.3% |
| Paiute | 0.0 /100 | #336 | Tragic 3.3% |
| Pueblo | 0.0 /100 | #337 | Tragic 3.3% |
| Sioux | 0.0 /100 | #338 | Tragic 3.3% |
| Alaskan Athabascans | 0.0 /100 | #339 | Tragic 3.4% |
| Alaska Natives | 0.0 /100 | #340 | Tragic 3.5% |
| Crow | 0.0 /100 | #341 | Tragic 3.5% |
| Tohono O'odham | 0.0 /100 | #342 | Tragic 3.8% |
| Pima | 0.0 /100 | #343 | Tragic 4.2% |
| Yakama | 0.0 /100 | #344 | Tragic 4.2% |
| Menominee | 0.0 /100 | #345 | Tragic 4.2% |
| Inupiat | 0.0 /100 | #346 | Tragic 4.9% |
| Yup'ik | 0.0 /100 | #347 | Tragic 5.4% |