Immigrants from Burma/Myanmar vs Immigrants from Ireland Median Household Income
COMPARE
Immigrants from Burma/Myanmar
Immigrants from Ireland
Median Household Income
Median Household Income Comparison
Immigrants from Burma/Myanmar
Immigrants from Ireland
$78,682
MEDIAN HOUSEHOLD INCOME
1.6/ 100
METRIC RATING
247th/ 347
METRIC RANK
$104,692
MEDIAN HOUSEHOLD INCOME
100.0/ 100
METRIC RATING
14th/ 347
METRIC RANK
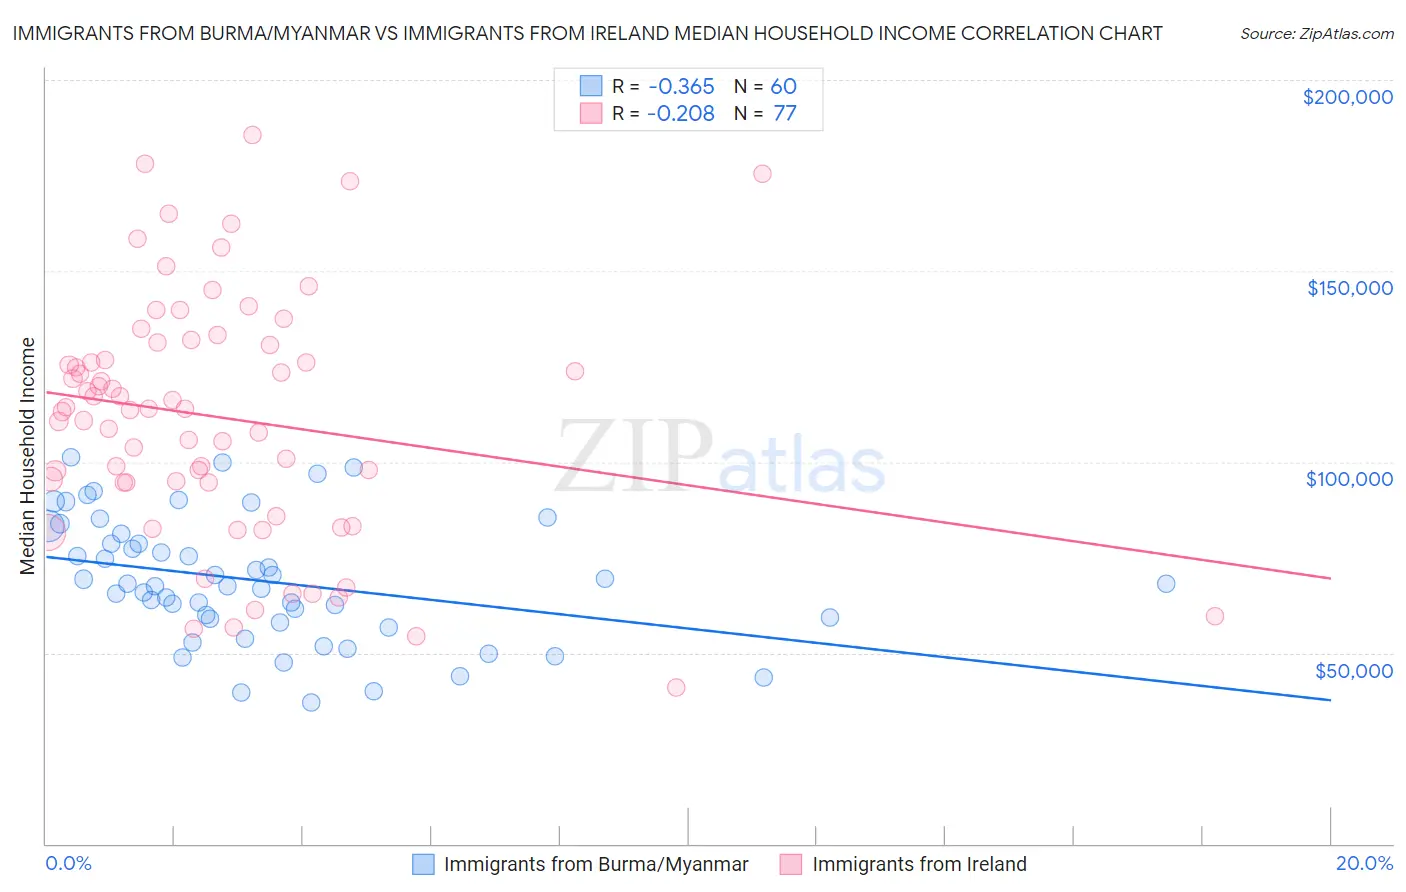
Immigrants from Burma/Myanmar vs Immigrants from Ireland Median Household Income Correlation Chart
The statistical analysis conducted on geographies consisting of 172,235,466 people shows a mild negative correlation between the proportion of Immigrants from Burma/Myanmar and median household income in the United States with a correlation coefficient (R) of -0.365 and weighted average of $78,682. Similarly, the statistical analysis conducted on geographies consisting of 240,715,462 people shows a weak negative correlation between the proportion of Immigrants from Ireland and median household income in the United States with a correlation coefficient (R) of -0.208 and weighted average of $104,692, a difference of 33.1%.
Median Household Income Correlation Summary
| Measurement | Immigrants from Burma/Myanmar | Immigrants from Ireland |
| Minimum | $36,966 | $40,962 |
| Maximum | $101,230 | $185,464 |
| Range | $64,264 | $144,502 |
| Mean | $68,823 | $111,627 |
| Median | $67,779 | $113,820 |
| Interquartile 25% (IQ1) | $58,487 | $94,548 |
| Interquartile 75% (IQ3) | $79,866 | $130,997 |
| Interquartile Range (IQR) | $21,379 | $36,449 |
| Standard Deviation (Sample) | $16,228 | $31,764 |
| Standard Deviation (Population) | $16,092 | $31,557 |
Similar Demographics by Median Household Income
Demographics Similar to Immigrants from Burma/Myanmar by Median Household Income
In terms of median household income, the demographic groups most similar to Immigrants from Burma/Myanmar are Central American ($78,803, a difference of 0.15%), Sudanese ($78,529, a difference of 0.19%), Inupiat ($78,841, a difference of 0.20%), West Indian ($78,455, a difference of 0.29%), and Marshallese ($78,930, a difference of 0.32%).
| Demographics | Rating | Rank | Median Household Income |
| Immigrants | Western Africa | 2.7 /100 | #240 | Tragic $79,490 |
| Immigrants | Nonimmigrants | 2.6 /100 | #241 | Tragic $79,429 |
| Immigrants | Sudan | 2.1 /100 | #242 | Tragic $79,103 |
| Immigrants | Barbados | 1.9 /100 | #243 | Tragic $78,989 |
| Marshallese | 1.9 /100 | #244 | Tragic $78,930 |
| Inupiat | 1.8 /100 | #245 | Tragic $78,841 |
| Central Americans | 1.7 /100 | #246 | Tragic $78,803 |
| Immigrants | Burma/Myanmar | 1.6 /100 | #247 | Tragic $78,682 |
| Sudanese | 1.5 /100 | #248 | Tragic $78,529 |
| West Indians | 1.4 /100 | #249 | Tragic $78,455 |
| Immigrants | Laos | 1.3 /100 | #250 | Tragic $78,327 |
| Mexican American Indians | 1.2 /100 | #251 | Tragic $78,166 |
| Immigrants | West Indies | 1.0 /100 | #252 | Tragic $77,956 |
| Immigrants | St. Vincent and the Grenadines | 0.9 /100 | #253 | Tragic $77,690 |
| Sub-Saharan Africans | 0.8 /100 | #254 | Tragic $77,631 |
Demographics Similar to Immigrants from Ireland by Median Household Income
In terms of median household income, the demographic groups most similar to Immigrants from Ireland are Immigrants from Eastern Asia ($104,796, a difference of 0.10%), Indian (Asian) ($105,262, a difference of 0.54%), Immigrants from Israel ($104,090, a difference of 0.58%), Immigrants from China ($105,335, a difference of 0.61%), and Immigrants from South Central Asia ($106,057, a difference of 1.3%).
| Demographics | Rating | Rank | Median Household Income |
| Iranians | 100.0 /100 | #7 | Exceptional $109,835 |
| Immigrants | Iran | 100.0 /100 | #8 | Exceptional $108,055 |
| Okinawans | 100.0 /100 | #9 | Exceptional $106,624 |
| Immigrants | South Central Asia | 100.0 /100 | #10 | Exceptional $106,057 |
| Immigrants | China | 100.0 /100 | #11 | Exceptional $105,335 |
| Indians (Asian) | 100.0 /100 | #12 | Exceptional $105,262 |
| Immigrants | Eastern Asia | 100.0 /100 | #13 | Exceptional $104,796 |
| Immigrants | Ireland | 100.0 /100 | #14 | Exceptional $104,692 |
| Immigrants | Israel | 100.0 /100 | #15 | Exceptional $104,090 |
| Burmese | 100.0 /100 | #16 | Exceptional $103,145 |
| Immigrants | Korea | 100.0 /100 | #17 | Exceptional $102,962 |
| Cypriots | 100.0 /100 | #18 | Exceptional $102,843 |
| Immigrants | Australia | 100.0 /100 | #19 | Exceptional $102,562 |
| Bolivians | 100.0 /100 | #20 | Exceptional $102,195 |
| Eastern Europeans | 100.0 /100 | #21 | Exceptional $101,781 |