Immigrants from England vs South African Family Households
COMPARE
Immigrants from England
South African
Family Households
Family Households Comparison
Immigrants from England
South Africans
64.4%
FAMILY HOUSEHOLDS
62.6/ 100
METRIC RATING
161st/ 347
METRIC RANK
63.4%
FAMILY HOUSEHOLDS
1.9/ 100
METRIC RATING
240th/ 347
METRIC RANK
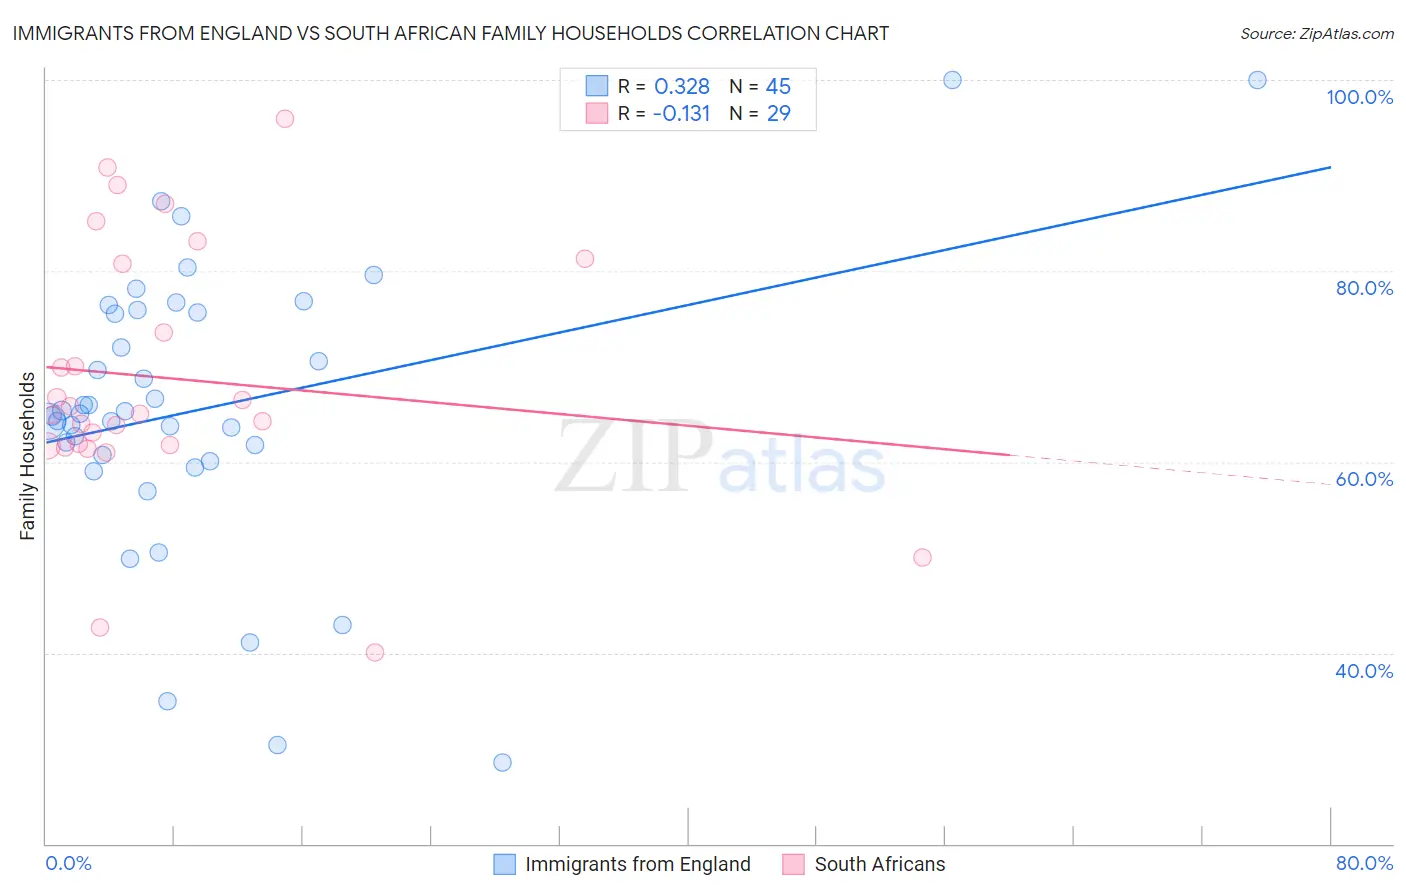
Immigrants from England vs South African Family Households Correlation Chart
The statistical analysis conducted on geographies consisting of 391,752,954 people shows a mild positive correlation between the proportion of Immigrants from England and percentage of family households in the United States with a correlation coefficient (R) of 0.328 and weighted average of 64.4%. Similarly, the statistical analysis conducted on geographies consisting of 182,542,946 people shows a poor negative correlation between the proportion of South Africans and percentage of family households in the United States with a correlation coefficient (R) of -0.131 and weighted average of 63.4%, a difference of 1.5%.
Family Households Correlation Summary
| Measurement | Immigrants from England | South African |
| Minimum | 28.6% | 40.0% |
| Maximum | 100.0% | 96.0% |
| Range | 71.4% | 56.0% |
| Mean | 65.6% | 68.7% |
| Median | 65.0% | 65.1% |
| Interquartile 25% (IQ1) | 60.4% | 61.7% |
| Interquartile 75% (IQ3) | 75.8% | 81.0% |
| Interquartile Range (IQR) | 15.4% | 19.3% |
| Standard Deviation (Sample) | 15.1% | 13.5% |
| Standard Deviation (Population) | 14.9% | 13.2% |
Similar Demographics by Family Households
Demographics Similar to Immigrants from England by Family Households
In terms of family households, the demographic groups most similar to Immigrants from England are British (64.4%, a difference of 0.010%), Chickasaw (64.4%, a difference of 0.020%), Immigrants from Moldova (64.4%, a difference of 0.040%), Immigrants from Nigeria (64.4%, a difference of 0.040%), and Immigrants from Southern Europe (64.4%, a difference of 0.040%).
| Demographics | Rating | Rank | Family Households |
| Austrians | 68.5 /100 | #154 | Good 64.5% |
| Uruguayans | 67.7 /100 | #155 | Good 64.5% |
| Czechs | 67.0 /100 | #156 | Good 64.5% |
| Canadians | 66.6 /100 | #157 | Good 64.4% |
| Lebanese | 66.4 /100 | #158 | Good 64.4% |
| Germans | 65.8 /100 | #159 | Good 64.4% |
| Immigrants | Moldova | 65.2 /100 | #160 | Good 64.4% |
| Immigrants | England | 62.6 /100 | #161 | Good 64.4% |
| British | 61.6 /100 | #162 | Good 64.4% |
| Chickasaw | 61.5 /100 | #163 | Good 64.4% |
| Immigrants | Nigeria | 60.1 /100 | #164 | Good 64.4% |
| Immigrants | Southern Europe | 60.0 /100 | #165 | Good 64.4% |
| Scotch-Irish | 59.2 /100 | #166 | Average 64.4% |
| Irish | 57.9 /100 | #167 | Average 64.4% |
| Hondurans | 57.5 /100 | #168 | Average 64.4% |
Demographics Similar to South Africans by Family Households
In terms of family households, the demographic groups most similar to South Africans are Aleut (63.4%, a difference of 0.0%), Immigrants from St. Vincent and the Grenadines (63.4%, a difference of 0.010%), Immigrants from Israel (63.4%, a difference of 0.010%), Comanche (63.5%, a difference of 0.030%), and Immigrants from Zimbabwe (63.5%, a difference of 0.030%).
| Demographics | Rating | Rank | Family Households |
| Immigrants | Armenia | 2.6 /100 | #233 | Tragic 63.5% |
| Finns | 2.3 /100 | #234 | Tragic 63.5% |
| Albanians | 2.2 /100 | #235 | Tragic 63.5% |
| Ghanaians | 2.1 /100 | #236 | Tragic 63.5% |
| Comanche | 2.1 /100 | #237 | Tragic 63.5% |
| Immigrants | Zimbabwe | 2.0 /100 | #238 | Tragic 63.5% |
| Aleuts | 1.9 /100 | #239 | Tragic 63.4% |
| South Africans | 1.9 /100 | #240 | Tragic 63.4% |
| Immigrants | St. Vincent and the Grenadines | 1.9 /100 | #241 | Tragic 63.4% |
| Immigrants | Israel | 1.8 /100 | #242 | Tragic 63.4% |
| Immigrants | Czechoslovakia | 1.8 /100 | #243 | Tragic 63.4% |
| Eastern Europeans | 1.6 /100 | #244 | Tragic 63.4% |
| Immigrants | Dominica | 1.6 /100 | #245 | Tragic 63.4% |
| Immigrants | Ghana | 1.6 /100 | #246 | Tragic 63.4% |
| Immigrants | Uzbekistan | 1.5 /100 | #247 | Tragic 63.4% |