Immigrants from Belarus vs Immigrants from Bulgaria Births to Unmarried Women
COMPARE
Immigrants from Belarus
Immigrants from Bulgaria
Births to Unmarried Women
Births to Unmarried Women Comparison
Immigrants from Belarus
Immigrants from Bulgaria
25.6%
BIRTHS TO UNMARRIED WOMEN
100.0/ 100
METRIC RATING
16th/ 347
METRIC RANK
27.6%
BIRTHS TO UNMARRIED WOMEN
99.6/ 100
METRIC RATING
43rd/ 347
METRIC RANK
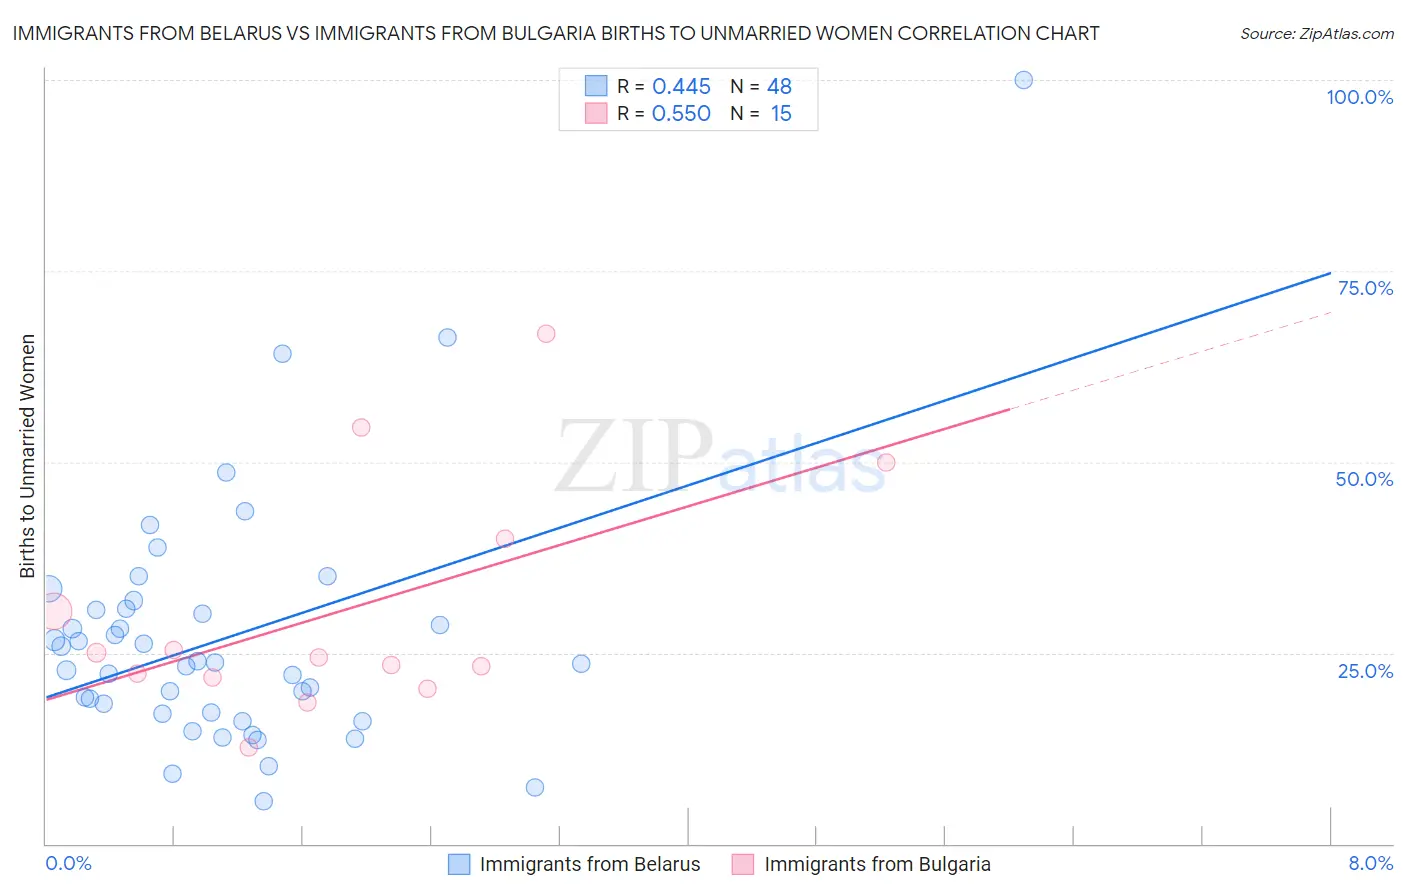
Immigrants from Belarus vs Immigrants from Bulgaria Births to Unmarried Women Correlation Chart
The statistical analysis conducted on geographies consisting of 142,991,373 people shows a moderate positive correlation between the proportion of Immigrants from Belarus and percentage of births to unmarried women in the United States with a correlation coefficient (R) of 0.445 and weighted average of 25.6%. Similarly, the statistical analysis conducted on geographies consisting of 164,531,570 people shows a substantial positive correlation between the proportion of Immigrants from Bulgaria and percentage of births to unmarried women in the United States with a correlation coefficient (R) of 0.550 and weighted average of 27.6%, a difference of 7.7%.
Births to Unmarried Women Correlation Summary
| Measurement | Immigrants from Belarus | Immigrants from Bulgaria |
| Minimum | 5.6% | 12.6% |
| Maximum | 100.0% | 66.7% |
| Range | 94.4% | 54.1% |
| Mean | 27.0% | 30.6% |
| Median | 23.7% | 24.4% |
| Interquartile 25% (IQ1) | 17.1% | 21.8% |
| Interquartile 75% (IQ3) | 30.7% | 40.0% |
| Interquartile Range (IQR) | 13.5% | 18.2% |
| Standard Deviation (Sample) | 16.5% | 15.3% |
| Standard Deviation (Population) | 16.3% | 14.8% |
Similar Demographics by Births to Unmarried Women
Demographics Similar to Immigrants from Belarus by Births to Unmarried Women
In terms of births to unmarried women, the demographic groups most similar to Immigrants from Belarus are Immigrants from Singapore (25.6%, a difference of 0.050%), Immigrants from Uzbekistan (25.8%, a difference of 0.57%), Immigrants from Lebanon (25.3%, a difference of 1.2%), Iranian (25.3%, a difference of 1.3%), and Indian (Asian) (25.3%, a difference of 1.5%).
| Demographics | Rating | Rank | Births to Unmarried Women |
| Immigrants | South Central Asia | 100.0 /100 | #9 | Exceptional 24.7% |
| Immigrants | Eastern Asia | 100.0 /100 | #10 | Exceptional 25.0% |
| Immigrants | Israel | 100.0 /100 | #11 | Exceptional 25.1% |
| Indians (Asian) | 100.0 /100 | #12 | Exceptional 25.3% |
| Iranians | 100.0 /100 | #13 | Exceptional 25.3% |
| Immigrants | Lebanon | 100.0 /100 | #14 | Exceptional 25.3% |
| Immigrants | Singapore | 100.0 /100 | #15 | Exceptional 25.6% |
| Immigrants | Belarus | 100.0 /100 | #16 | Exceptional 25.6% |
| Immigrants | Uzbekistan | 100.0 /100 | #17 | Exceptional 25.8% |
| Immigrants | Armenia | 99.9 /100 | #18 | Exceptional 26.1% |
| Armenians | 99.9 /100 | #19 | Exceptional 26.2% |
| Immigrants | Korea | 99.9 /100 | #20 | Exceptional 26.3% |
| Soviet Union | 99.9 /100 | #21 | Exceptional 26.3% |
| Burmese | 99.9 /100 | #22 | Exceptional 26.4% |
| Immigrants | Japan | 99.9 /100 | #23 | Exceptional 26.4% |
Demographics Similar to Immigrants from Bulgaria by Births to Unmarried Women
In terms of births to unmarried women, the demographic groups most similar to Immigrants from Bulgaria are Immigrants from Eastern Europe (27.6%, a difference of 0.23%), Iraqi (27.6%, a difference of 0.24%), Immigrants from Indonesia (27.7%, a difference of 0.26%), Latvian (27.7%, a difference of 0.36%), and Immigrants from Lithuania (27.7%, a difference of 0.40%).
| Demographics | Rating | Rank | Births to Unmarried Women |
| Immigrants | Western Asia | 99.7 /100 | #36 | Exceptional 27.2% |
| Immigrants | Ukraine | 99.7 /100 | #37 | Exceptional 27.2% |
| Immigrants | Moldova | 99.7 /100 | #38 | Exceptional 27.3% |
| Immigrants | Malaysia | 99.7 /100 | #39 | Exceptional 27.4% |
| Turks | 99.6 /100 | #40 | Exceptional 27.4% |
| Iraqis | 99.6 /100 | #41 | Exceptional 27.6% |
| Immigrants | Eastern Europe | 99.6 /100 | #42 | Exceptional 27.6% |
| Immigrants | Bulgaria | 99.6 /100 | #43 | Exceptional 27.6% |
| Immigrants | Indonesia | 99.5 /100 | #44 | Exceptional 27.7% |
| Latvians | 99.5 /100 | #45 | Exceptional 27.7% |
| Immigrants | Lithuania | 99.5 /100 | #46 | Exceptional 27.7% |
| Hmong | 99.5 /100 | #47 | Exceptional 27.7% |
| Eastern Europeans | 99.5 /100 | #48 | Exceptional 27.7% |
| Immigrants | Greece | 99.4 /100 | #49 | Exceptional 27.8% |
| Maltese | 99.4 /100 | #50 | Exceptional 27.8% |