Immigrants from Barbados vs Croatian Disability Age 35 to 64
COMPARE
Immigrants from Barbados
Croatian
Disability Age 35 to 64
Disability Age 35 to 64 Comparison
Immigrants from Barbados
Croatians
11.3%
DISABILITY AGE 35 TO 64
41.6/ 100
METRIC RATING
179th/ 347
METRIC RANK
11.0%
DISABILITY AGE 35 TO 64
73.1/ 100
METRIC RATING
160th/ 347
METRIC RANK
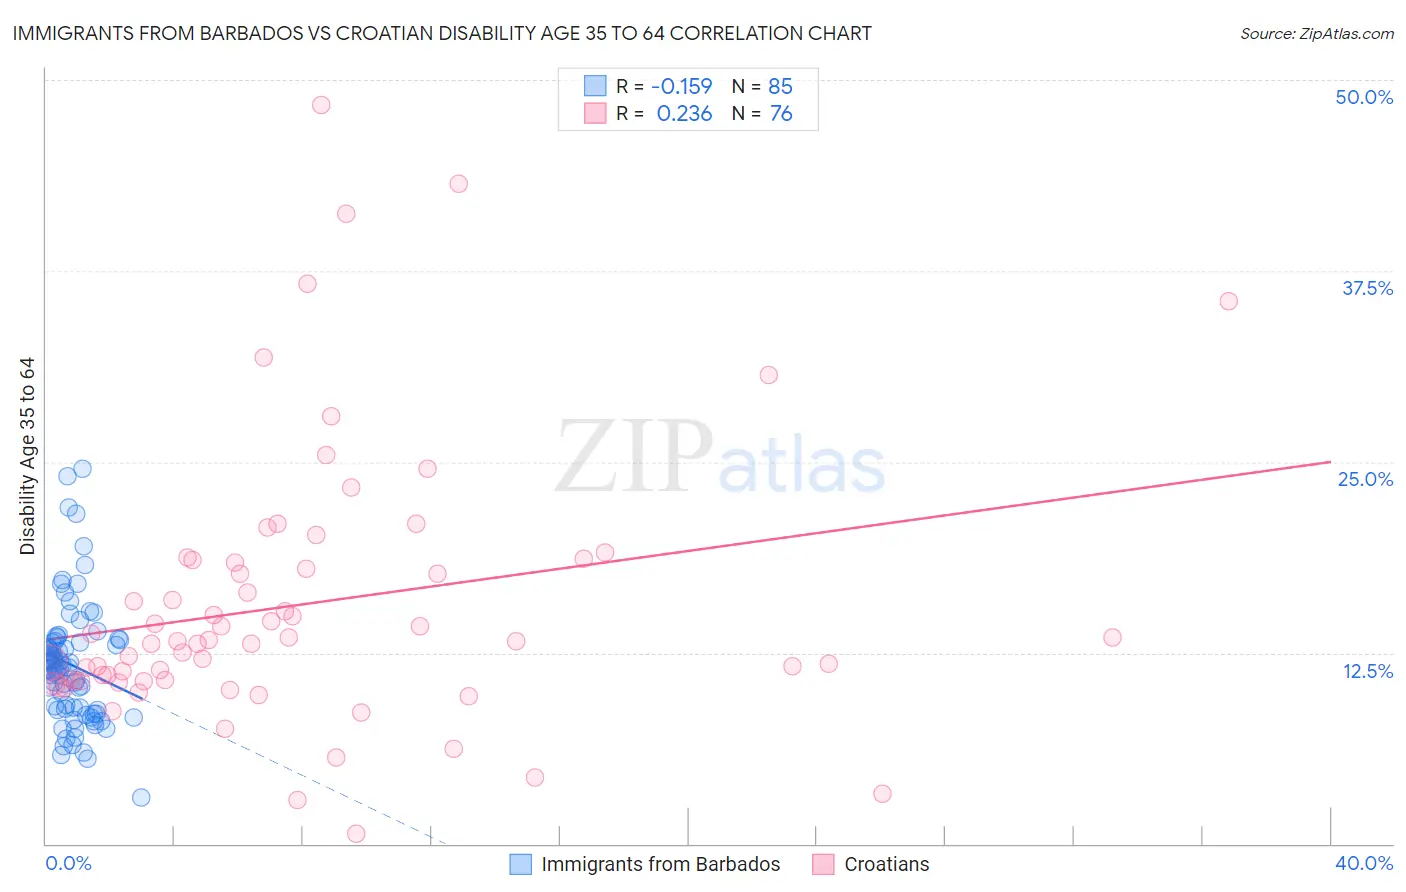
Immigrants from Barbados vs Croatian Disability Age 35 to 64 Correlation Chart
The statistical analysis conducted on geographies consisting of 112,766,273 people shows a poor negative correlation between the proportion of Immigrants from Barbados and percentage of population with a disability between the ages 34 and 64 in the United States with a correlation coefficient (R) of -0.159 and weighted average of 11.3%. Similarly, the statistical analysis conducted on geographies consisting of 375,480,501 people shows a weak positive correlation between the proportion of Croatians and percentage of population with a disability between the ages 34 and 64 in the United States with a correlation coefficient (R) of 0.236 and weighted average of 11.0%, a difference of 2.8%.
Disability Age 35 to 64 Correlation Summary
| Measurement | Immigrants from Barbados | Croatian |
| Minimum | 3.0% | 0.68% |
| Maximum | 24.6% | 48.4% |
| Range | 21.5% | 47.7% |
| Mean | 11.7% | 15.7% |
| Median | 11.5% | 13.3% |
| Interquartile 25% (IQ1) | 8.7% | 10.6% |
| Interquartile 75% (IQ3) | 13.3% | 18.5% |
| Interquartile Range (IQR) | 4.5% | 7.8% |
| Standard Deviation (Sample) | 4.0% | 8.9% |
| Standard Deviation (Population) | 4.0% | 8.9% |
Demographics Similar to Immigrants from Barbados and Croatians by Disability Age 35 to 64
In terms of disability age 35 to 64, the demographic groups most similar to Immigrants from Barbados are Polish (11.3%, a difference of 0.040%), Immigrants from Eastern Africa (11.3%, a difference of 0.060%), Ugandan (11.3%, a difference of 0.18%), Czech (11.3%, a difference of 0.52%), and Immigrants from Fiji (11.3%, a difference of 0.68%). Similarly, the demographic groups most similar to Croatians are Serbian (11.0%, a difference of 0.050%), Immigrants from Guyana (11.1%, a difference of 0.30%), Immigrants from Grenada (11.1%, a difference of 0.47%), Immigrants from St. Vincent and the Grenadines (11.1%, a difference of 0.63%), and Pakistani (11.1%, a difference of 0.71%).
| Demographics | Rating | Rank | Disability Age 35 to 64 |
| Serbians | 73.6 /100 | #159 | Good 11.0% |
| Croatians | 73.1 /100 | #160 | Good 11.0% |
| Immigrants | Guyana | 70.1 /100 | #161 | Good 11.1% |
| Immigrants | Grenada | 68.4 /100 | #162 | Good 11.1% |
| Immigrants | St. Vincent and the Grenadines | 66.6 /100 | #163 | Good 11.1% |
| Pakistanis | 65.8 /100 | #164 | Good 11.1% |
| Immigrants | Western Europe | 65.2 /100 | #165 | Good 11.1% |
| Immigrants | Haiti | 63.8 /100 | #166 | Good 11.1% |
| Austrians | 63.2 /100 | #167 | Good 11.1% |
| Central Americans | 59.1 /100 | #168 | Average 11.2% |
| Haitians | 59.0 /100 | #169 | Average 11.2% |
| Immigrants | Uganda | 58.0 /100 | #170 | Average 11.2% |
| Immigrants | Trinidad and Tobago | 55.9 /100 | #171 | Average 11.2% |
| Italians | 55.6 /100 | #172 | Average 11.2% |
| Lebanese | 51.8 /100 | #173 | Average 11.3% |
| Immigrants | Fiji | 50.0 /100 | #174 | Average 11.3% |
| Czechs | 47.9 /100 | #175 | Average 11.3% |
| Ugandans | 43.7 /100 | #176 | Average 11.3% |
| Immigrants | Eastern Africa | 42.2 /100 | #177 | Average 11.3% |
| Poles | 42.0 /100 | #178 | Average 11.3% |
| Immigrants | Barbados | 41.6 /100 | #179 | Average 11.3% |