Immigrants from Barbados vs Central American Indian 11th Grade
COMPARE
Immigrants from Barbados
Central American Indian
11th Grade
11th Grade Comparison
Immigrants from Barbados
Central American Indians
90.7%
11TH GRADE
0.0/ 100
METRIC RATING
283rd/ 347
METRIC RANK
88.2%
11TH GRADE
0.0/ 100
METRIC RATING
324th/ 347
METRIC RANK
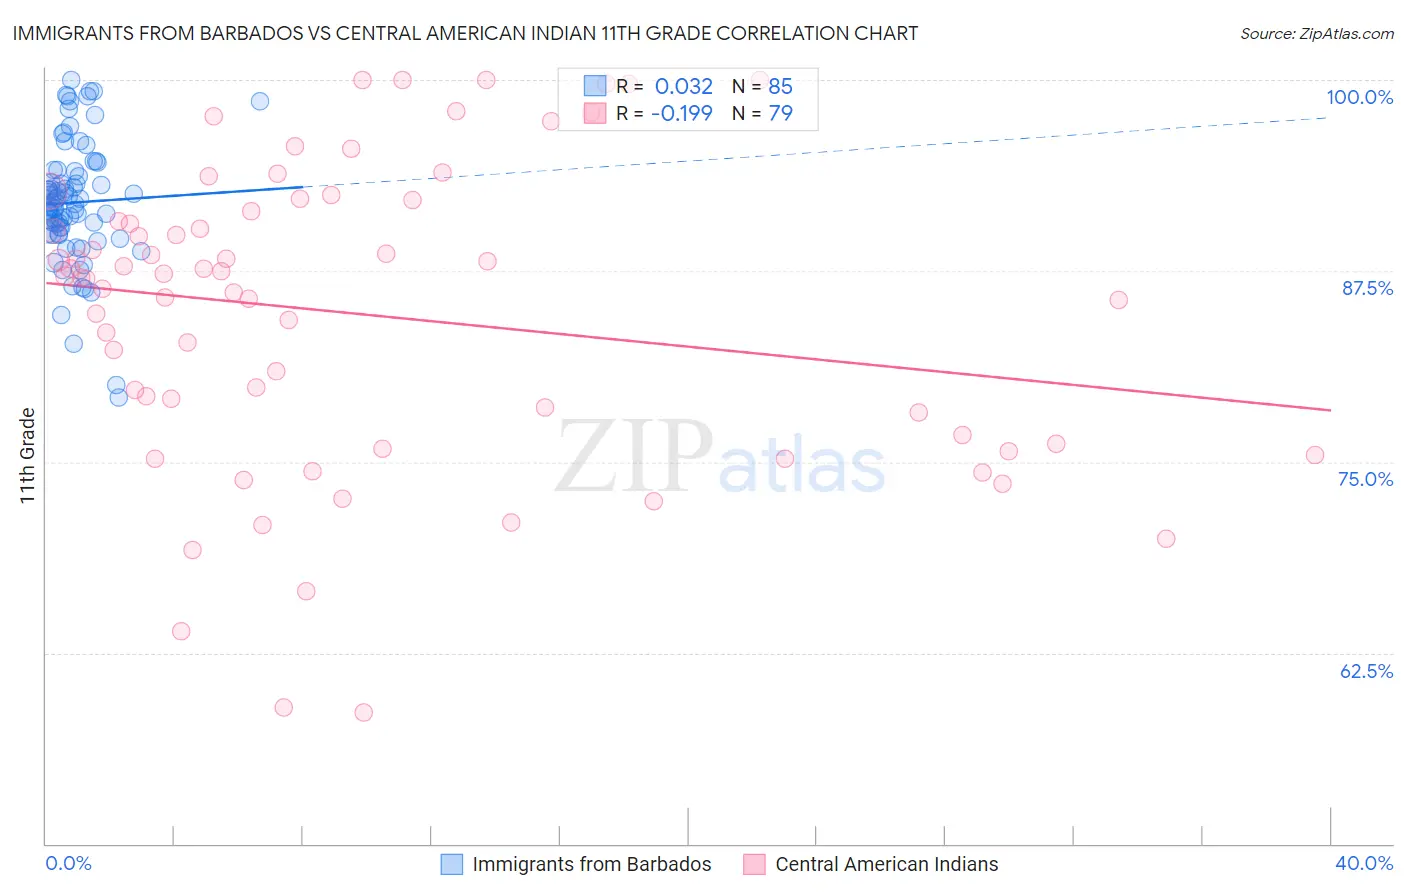
Immigrants from Barbados vs Central American Indian 11th Grade Correlation Chart
The statistical analysis conducted on geographies consisting of 112,782,130 people shows no correlation between the proportion of Immigrants from Barbados and percentage of population with at least 11th grade education in the United States with a correlation coefficient (R) of 0.032 and weighted average of 90.7%. Similarly, the statistical analysis conducted on geographies consisting of 326,142,643 people shows a poor negative correlation between the proportion of Central American Indians and percentage of population with at least 11th grade education in the United States with a correlation coefficient (R) of -0.199 and weighted average of 88.2%, a difference of 2.7%.
11th Grade Correlation Summary
| Measurement | Immigrants from Barbados | Central American Indian |
| Minimum | 79.2% | 58.6% |
| Maximum | 100.0% | 100.0% |
| Range | 20.8% | 41.4% |
| Mean | 92.0% | 84.6% |
| Median | 92.0% | 87.1% |
| Interquartile 25% (IQ1) | 90.0% | 76.2% |
| Interquartile 75% (IQ3) | 94.1% | 91.4% |
| Interquartile Range (IQR) | 4.1% | 15.2% |
| Standard Deviation (Sample) | 4.0% | 9.9% |
| Standard Deviation (Population) | 4.0% | 9.8% |
Similar Demographics by 11th Grade
Demographics Similar to Immigrants from Barbados by 11th Grade
In terms of 11th grade, the demographic groups most similar to Immigrants from Barbados are Immigrants from St. Vincent and the Grenadines (90.7%, a difference of 0.010%), Dutch West Indian (90.7%, a difference of 0.020%), Sri Lankan (90.7%, a difference of 0.070%), Barbadian (90.8%, a difference of 0.14%), and Immigrants from Laos (90.5%, a difference of 0.17%).
| Demographics | Rating | Rank | 11th Grade |
| Bangladeshis | 0.1 /100 | #276 | Tragic 90.9% |
| Immigrants | Congo | 0.1 /100 | #277 | Tragic 90.9% |
| Malaysians | 0.1 /100 | #278 | Tragic 90.8% |
| Barbadians | 0.0 /100 | #279 | Tragic 90.8% |
| Sri Lankans | 0.0 /100 | #280 | Tragic 90.7% |
| Dutch West Indians | 0.0 /100 | #281 | Tragic 90.7% |
| Immigrants | St. Vincent and the Grenadines | 0.0 /100 | #282 | Tragic 90.7% |
| Immigrants | Barbados | 0.0 /100 | #283 | Tragic 90.7% |
| Immigrants | Laos | 0.0 /100 | #284 | Tragic 90.5% |
| Immigrants | Burma/Myanmar | 0.0 /100 | #285 | Tragic 90.4% |
| Immigrants | West Indies | 0.0 /100 | #286 | Tragic 90.4% |
| Apache | 0.0 /100 | #287 | Tragic 90.4% |
| Pennsylvania Germans | 0.0 /100 | #288 | Tragic 90.3% |
| British West Indians | 0.0 /100 | #289 | Tragic 90.3% |
| Indonesians | 0.0 /100 | #290 | Tragic 90.3% |
Demographics Similar to Central American Indians by 11th Grade
In terms of 11th grade, the demographic groups most similar to Central American Indians are Pima (88.3%, a difference of 0.040%), Puerto Rican (88.4%, a difference of 0.12%), Immigrants from Nicaragua (88.1%, a difference of 0.13%), Immigrants from Belize (88.7%, a difference of 0.51%), and Immigrants from Armenia (88.8%, a difference of 0.60%).
| Demographics | Rating | Rank | 11th Grade |
| Lumbee | 0.0 /100 | #317 | Tragic 88.9% |
| Nicaraguans | 0.0 /100 | #318 | Tragic 88.9% |
| Belizeans | 0.0 /100 | #319 | Tragic 88.8% |
| Immigrants | Armenia | 0.0 /100 | #320 | Tragic 88.8% |
| Immigrants | Belize | 0.0 /100 | #321 | Tragic 88.7% |
| Puerto Ricans | 0.0 /100 | #322 | Tragic 88.4% |
| Pima | 0.0 /100 | #323 | Tragic 88.3% |
| Central American Indians | 0.0 /100 | #324 | Tragic 88.2% |
| Immigrants | Nicaragua | 0.0 /100 | #325 | Tragic 88.1% |
| Dominicans | 0.0 /100 | #326 | Tragic 87.7% |
| Immigrants | Cabo Verde | 0.0 /100 | #327 | Tragic 87.6% |
| Tohono O'odham | 0.0 /100 | #328 | Tragic 87.6% |
| Mexican American Indians | 0.0 /100 | #329 | Tragic 87.5% |
| Hondurans | 0.0 /100 | #330 | Tragic 87.4% |
| Hispanics or Latinos | 0.0 /100 | #331 | Tragic 87.3% |