Immigrants from Barbados vs Central American Indian Family Households with Children
COMPARE
Immigrants from Barbados
Central American Indian
Family Households with Children
Family Households with Children Comparison
Immigrants from Barbados
Central American Indians
26.0%
FAMILY HOUSEHOLDS WITH CHILDREN
0.0/ 100
METRIC RATING
327th/ 347
METRIC RANK
27.9%
FAMILY HOUSEHOLDS WITH CHILDREN
95.9/ 100
METRIC RATING
118th/ 347
METRIC RANK
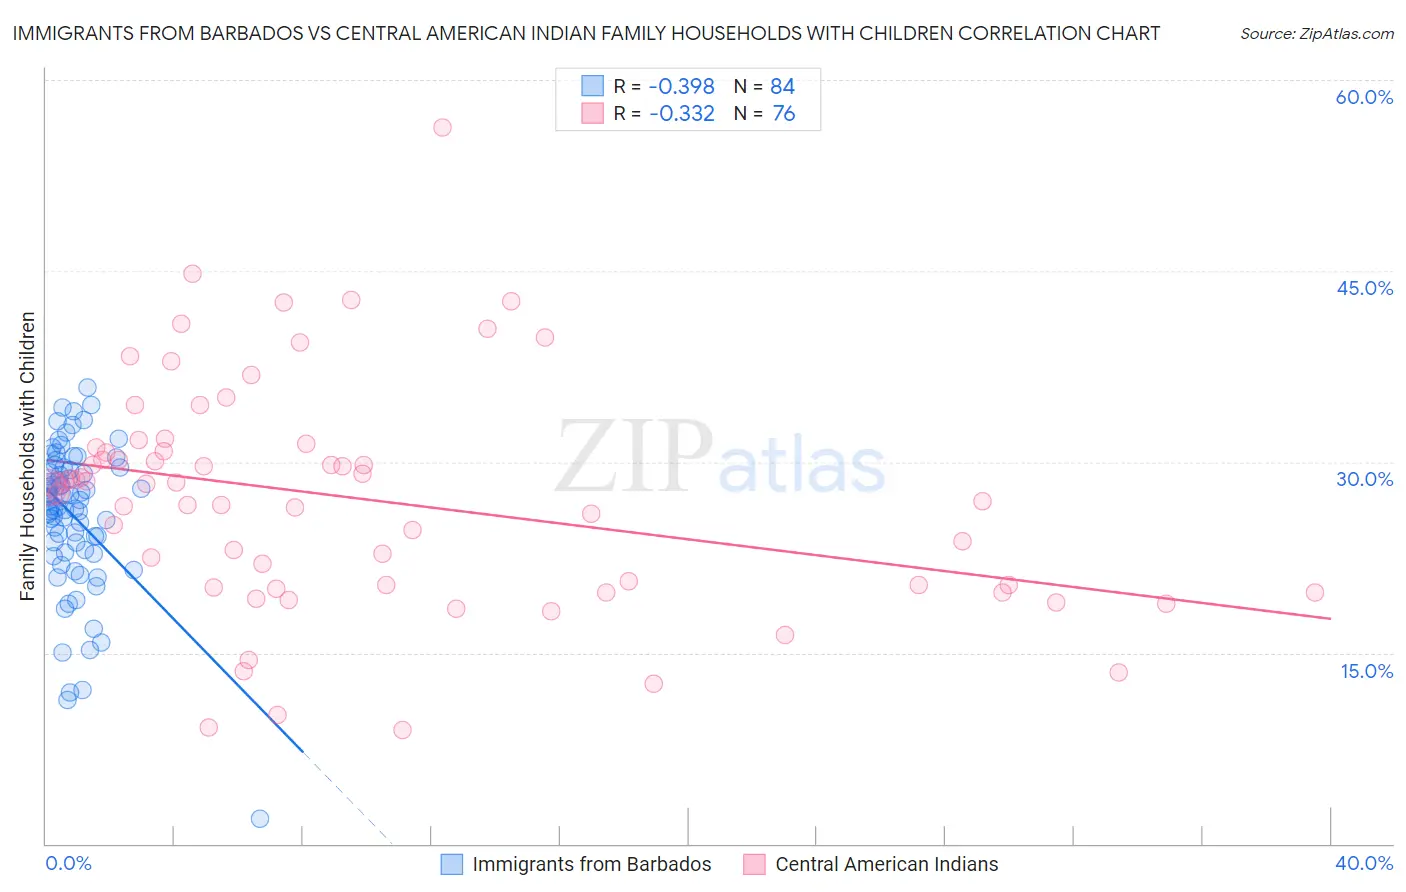
Immigrants from Barbados vs Central American Indian Family Households with Children Correlation Chart
The statistical analysis conducted on geographies consisting of 112,760,872 people shows a mild negative correlation between the proportion of Immigrants from Barbados and percentage of family households with children in the United States with a correlation coefficient (R) of -0.398 and weighted average of 26.0%. Similarly, the statistical analysis conducted on geographies consisting of 326,008,789 people shows a mild negative correlation between the proportion of Central American Indians and percentage of family households with children in the United States with a correlation coefficient (R) of -0.332 and weighted average of 27.9%, a difference of 7.6%.
Family Households with Children Correlation Summary
| Measurement | Immigrants from Barbados | Central American Indian |
| Minimum | 2.0% | 9.0% |
| Maximum | 35.9% | 56.2% |
| Range | 33.9% | 47.2% |
| Mean | 25.7% | 27.1% |
| Median | 26.8% | 28.1% |
| Interquartile 25% (IQ1) | 23.0% | 20.2% |
| Interquartile 75% (IQ3) | 29.5% | 31.0% |
| Interquartile Range (IQR) | 6.5% | 10.8% |
| Standard Deviation (Sample) | 5.9% | 9.0% |
| Standard Deviation (Population) | 5.8% | 8.9% |
Similar Demographics by Family Households with Children
Demographics Similar to Immigrants from Barbados by Family Households with Children
In terms of family households with children, the demographic groups most similar to Immigrants from Barbados are Immigrants from Albania (25.9%, a difference of 0.10%), Immigrants from Ireland (26.0%, a difference of 0.11%), Barbadian (26.0%, a difference of 0.14%), Chinese (26.0%, a difference of 0.19%), and Immigrants from Australia (26.0%, a difference of 0.23%).
| Demographics | Rating | Rank | Family Households with Children |
| Tlingit-Haida | 0.0 /100 | #320 | Tragic 26.0% |
| British West Indians | 0.0 /100 | #321 | Tragic 26.0% |
| Immigrants | Greece | 0.0 /100 | #322 | Tragic 26.0% |
| Immigrants | Australia | 0.0 /100 | #323 | Tragic 26.0% |
| Chinese | 0.0 /100 | #324 | Tragic 26.0% |
| Barbadians | 0.0 /100 | #325 | Tragic 26.0% |
| Immigrants | Ireland | 0.0 /100 | #326 | Tragic 26.0% |
| Immigrants | Barbados | 0.0 /100 | #327 | Tragic 26.0% |
| Immigrants | Albania | 0.0 /100 | #328 | Tragic 25.9% |
| Cypriots | 0.0 /100 | #329 | Tragic 25.9% |
| Immigrants | Latvia | 0.0 /100 | #330 | Tragic 25.9% |
| Slovenes | 0.0 /100 | #331 | Tragic 25.8% |
| Immigrants | Austria | 0.0 /100 | #332 | Tragic 25.8% |
| Immigrants | Switzerland | 0.0 /100 | #333 | Tragic 25.7% |
| Slovaks | 0.0 /100 | #334 | Tragic 25.7% |
Demographics Similar to Central American Indians by Family Households with Children
In terms of family households with children, the demographic groups most similar to Central American Indians are Immigrants from Malaysia (27.9%, a difference of 0.0%), Pakistani (27.9%, a difference of 0.010%), Zimbabwean (27.9%, a difference of 0.040%), European (27.9%, a difference of 0.070%), and Immigrants from Africa (28.0%, a difference of 0.14%).
| Demographics | Rating | Rank | Family Households with Children |
| Scandinavians | 97.1 /100 | #111 | Exceptional 28.0% |
| Immigrants | Middle Africa | 97.0 /100 | #112 | Exceptional 28.0% |
| Arabs | 97.0 /100 | #113 | Exceptional 28.0% |
| South American Indians | 96.9 /100 | #114 | Exceptional 28.0% |
| Immigrants | Africa | 96.8 /100 | #115 | Exceptional 28.0% |
| Pakistanis | 96.0 /100 | #116 | Exceptional 27.9% |
| Immigrants | Malaysia | 95.9 /100 | #117 | Exceptional 27.9% |
| Central American Indians | 95.9 /100 | #118 | Exceptional 27.9% |
| Zimbabweans | 95.6 /100 | #119 | Exceptional 27.9% |
| Europeans | 95.4 /100 | #120 | Exceptional 27.9% |
| Immigrants | Western Asia | 93.6 /100 | #121 | Exceptional 27.9% |
| Immigrants | Zimbabwe | 92.8 /100 | #122 | Exceptional 27.8% |
| Immigrants | Northern Africa | 91.8 /100 | #123 | Exceptional 27.8% |
| Immigrants | Singapore | 90.8 /100 | #124 | Exceptional 27.8% |
| Ecuadorians | 90.8 /100 | #125 | Exceptional 27.8% |