Immigrants from the Azores vs Italian In Labor Force | Age 45-54
COMPARE
Immigrants from the Azores
Italian
In Labor Force | Age 45-54
In Labor Force | Age 45-54 Comparison
Immigrants from the Azores
Italians
80.1%
IN LABOR FORCE | AGE 45-54
0.0/ 100
METRIC RATING
303rd/ 347
METRIC RANK
83.3%
IN LABOR FORCE | AGE 45-54
95.1/ 100
METRIC RATING
93rd/ 347
METRIC RANK
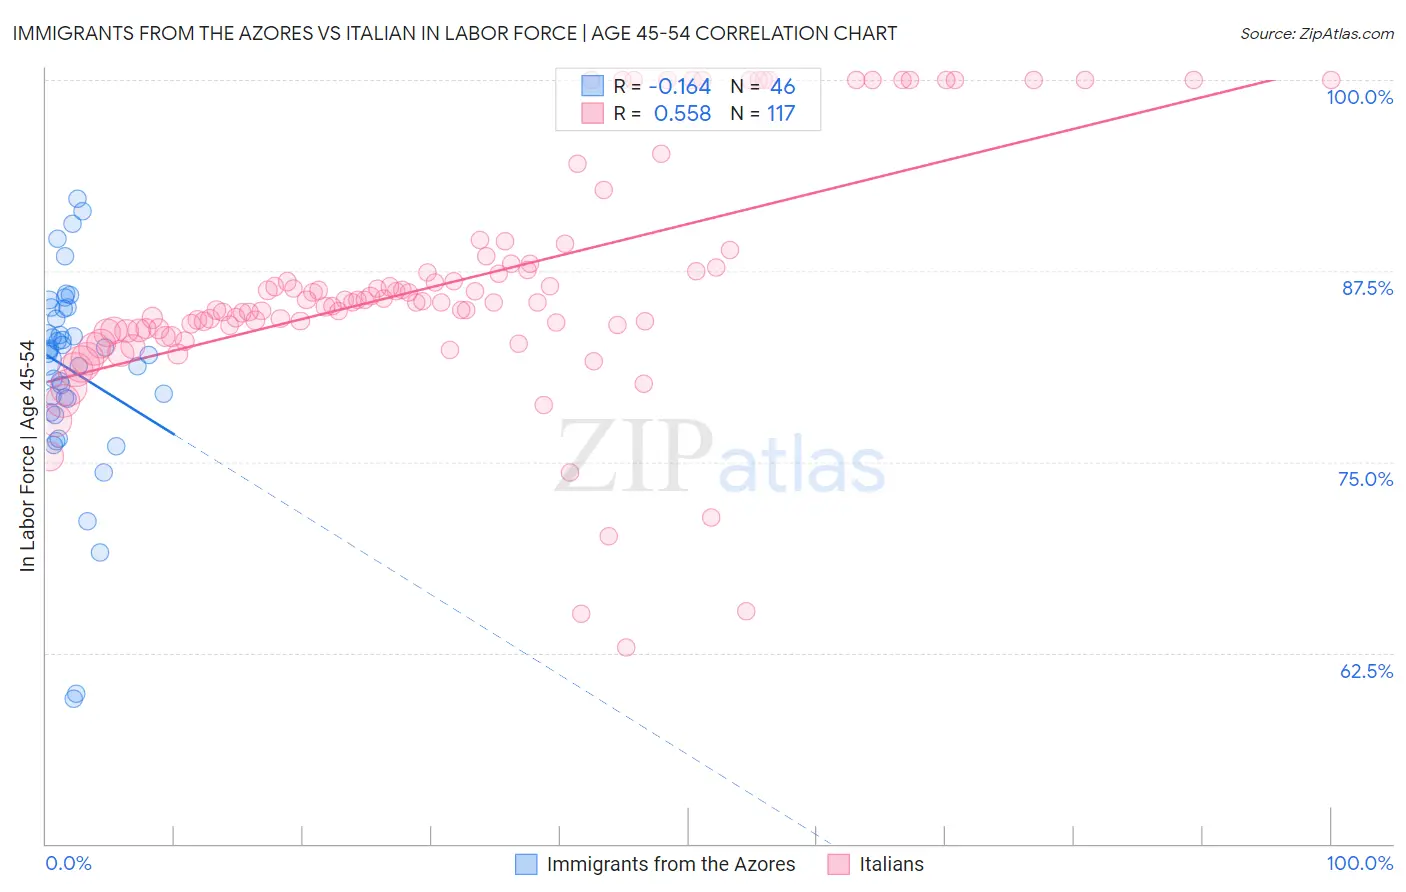
Immigrants from the Azores vs Italian In Labor Force | Age 45-54 Correlation Chart
The statistical analysis conducted on geographies consisting of 46,256,380 people shows a poor negative correlation between the proportion of Immigrants from the Azores and labor force participation rate among population between the ages 45 and 54 in the United States with a correlation coefficient (R) of -0.164 and weighted average of 80.1%. Similarly, the statistical analysis conducted on geographies consisting of 574,249,528 people shows a substantial positive correlation between the proportion of Italians and labor force participation rate among population between the ages 45 and 54 in the United States with a correlation coefficient (R) of 0.558 and weighted average of 83.3%, a difference of 4.0%.
In Labor Force | Age 45-54 Correlation Summary
| Measurement | Immigrants from the Azores | Italian |
| Minimum | 59.5% | 62.8% |
| Maximum | 92.2% | 100.0% |
| Range | 32.7% | 37.2% |
| Mean | 81.0% | 86.7% |
| Median | 82.2% | 85.4% |
| Interquartile 25% (IQ1) | 79.1% | 83.6% |
| Interquartile 75% (IQ3) | 85.0% | 87.9% |
| Interquartile Range (IQR) | 5.9% | 4.3% |
| Standard Deviation (Sample) | 6.6% | 7.7% |
| Standard Deviation (Population) | 6.5% | 7.6% |
Similar Demographics by In Labor Force | Age 45-54
Demographics Similar to Immigrants from the Azores by In Labor Force | Age 45-54
In terms of in labor force | age 45-54, the demographic groups most similar to Immigrants from the Azores are Hispanic or Latino (80.1%, a difference of 0.020%), Immigrants from Dominican Republic (80.1%, a difference of 0.030%), Immigrants from Central America (80.2%, a difference of 0.070%), Spanish American (80.1%, a difference of 0.070%), and Spanish American Indian (80.2%, a difference of 0.14%).
| Demographics | Rating | Rank | In Labor Force | Age 45-54 |
| Africans | 0.0 /100 | #296 | Tragic 80.5% |
| Americans | 0.0 /100 | #297 | Tragic 80.4% |
| Marshallese | 0.0 /100 | #298 | Tragic 80.3% |
| Dominicans | 0.0 /100 | #299 | Tragic 80.3% |
| Fijians | 0.0 /100 | #300 | Tragic 80.2% |
| Spanish American Indians | 0.0 /100 | #301 | Tragic 80.2% |
| Immigrants | Central America | 0.0 /100 | #302 | Tragic 80.2% |
| Immigrants | Azores | 0.0 /100 | #303 | Tragic 80.1% |
| Hispanics or Latinos | 0.0 /100 | #304 | Tragic 80.1% |
| Immigrants | Dominican Republic | 0.0 /100 | #305 | Tragic 80.1% |
| Spanish Americans | 0.0 /100 | #306 | Tragic 80.1% |
| Blackfeet | 0.0 /100 | #307 | Tragic 80.0% |
| Central American Indians | 0.0 /100 | #308 | Tragic 80.0% |
| Potawatomi | 0.0 /100 | #309 | Tragic 80.0% |
| Inupiat | 0.0 /100 | #310 | Tragic 79.9% |
Demographics Similar to Italians by In Labor Force | Age 45-54
In terms of in labor force | age 45-54, the demographic groups most similar to Italians are Danish (83.3%, a difference of 0.010%), Argentinean (83.3%, a difference of 0.010%), Immigrants from Argentina (83.3%, a difference of 0.010%), Immigrants from Eastern Europe (83.3%, a difference of 0.020%), and Immigrants from Asia (83.3%, a difference of 0.020%).
| Demographics | Rating | Rank | In Labor Force | Age 45-54 |
| Immigrants | Northern Africa | 95.7 /100 | #86 | Exceptional 83.3% |
| Immigrants | Eastern Europe | 95.6 /100 | #87 | Exceptional 83.3% |
| Immigrants | Asia | 95.6 /100 | #88 | Exceptional 83.3% |
| Indians (Asian) | 95.5 /100 | #89 | Exceptional 83.3% |
| Immigrants | Japan | 95.5 /100 | #90 | Exceptional 83.3% |
| South Americans | 95.5 /100 | #91 | Exceptional 83.3% |
| Danes | 95.3 /100 | #92 | Exceptional 83.3% |
| Italians | 95.1 /100 | #93 | Exceptional 83.3% |
| Argentineans | 94.9 /100 | #94 | Exceptional 83.3% |
| Immigrants | Argentina | 94.9 /100 | #95 | Exceptional 83.3% |
| Immigrants | Kuwait | 94.8 /100 | #96 | Exceptional 83.3% |
| Palestinians | 94.8 /100 | #97 | Exceptional 83.3% |
| Maltese | 94.4 /100 | #98 | Exceptional 83.3% |
| Immigrants | Middle Africa | 94.3 /100 | #99 | Exceptional 83.3% |
| Mongolians | 94.2 /100 | #100 | Exceptional 83.3% |