Immigrants from the Azores vs Immigrants from England Family Households
COMPARE
Immigrants from the Azores
Immigrants from England
Family Households
Family Households Comparison
Immigrants from the Azores
Immigrants from England
65.6%
FAMILY HOUSEHOLDS
99.8/ 100
METRIC RATING
76th/ 347
METRIC RANK
64.4%
FAMILY HOUSEHOLDS
62.6/ 100
METRIC RATING
161st/ 347
METRIC RANK
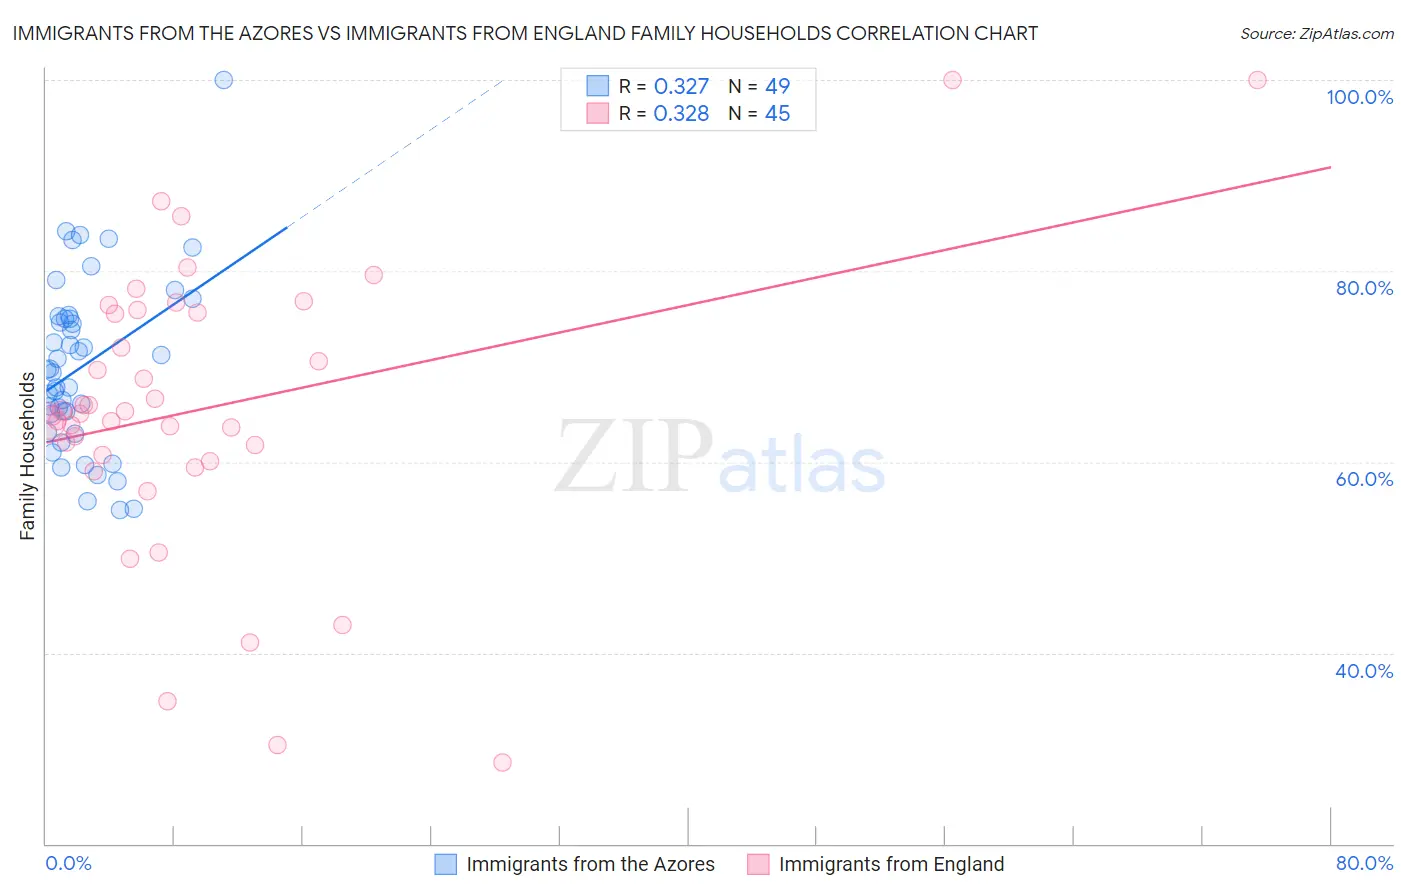
Immigrants from the Azores vs Immigrants from England Family Households Correlation Chart
The statistical analysis conducted on geographies consisting of 46,257,310 people shows a mild positive correlation between the proportion of Immigrants from the Azores and percentage of family households in the United States with a correlation coefficient (R) of 0.327 and weighted average of 65.6%. Similarly, the statistical analysis conducted on geographies consisting of 391,752,954 people shows a mild positive correlation between the proportion of Immigrants from England and percentage of family households in the United States with a correlation coefficient (R) of 0.328 and weighted average of 64.4%, a difference of 1.9%.
Family Households Correlation Summary
| Measurement | Immigrants from the Azores | Immigrants from England |
| Minimum | 54.9% | 28.6% |
| Maximum | 100.0% | 100.0% |
| Range | 45.1% | 71.4% |
| Mean | 70.1% | 65.6% |
| Median | 69.6% | 65.0% |
| Interquartile 25% (IQ1) | 64.1% | 60.4% |
| Interquartile 75% (IQ3) | 75.1% | 75.8% |
| Interquartile Range (IQR) | 11.0% | 15.4% |
| Standard Deviation (Sample) | 9.1% | 15.1% |
| Standard Deviation (Population) | 9.0% | 14.9% |
Similar Demographics by Family Households
Demographics Similar to Immigrants from the Azores by Family Households
In terms of family households, the demographic groups most similar to Immigrants from the Azores are Immigrants from South America (65.6%, a difference of 0.010%), Yaqui (65.6%, a difference of 0.010%), Immigrants from Costa Rica (65.6%, a difference of 0.040%), Puget Sound Salish (65.6%, a difference of 0.060%), and Houma (65.7%, a difference of 0.12%).
| Demographics | Rating | Rank | Family Households |
| Malaysians | 99.9 /100 | #69 | Exceptional 65.9% |
| Immigrants | Afghanistan | 99.9 /100 | #70 | Exceptional 65.9% |
| Bhutanese | 99.9 /100 | #71 | Exceptional 65.9% |
| Portuguese | 99.9 /100 | #72 | Exceptional 65.8% |
| Laotians | 99.9 /100 | #73 | Exceptional 65.8% |
| Burmese | 99.9 /100 | #74 | Exceptional 65.7% |
| Houma | 99.9 /100 | #75 | Exceptional 65.7% |
| Immigrants | Azores | 99.8 /100 | #76 | Exceptional 65.6% |
| Immigrants | South America | 99.8 /100 | #77 | Exceptional 65.6% |
| Yaqui | 99.8 /100 | #78 | Exceptional 65.6% |
| Immigrants | Costa Rica | 99.8 /100 | #79 | Exceptional 65.6% |
| Puget Sound Salish | 99.8 /100 | #80 | Exceptional 65.6% |
| Jordanians | 99.7 /100 | #81 | Exceptional 65.5% |
| Immigrants | Lebanon | 99.7 /100 | #82 | Exceptional 65.5% |
| Immigrants | Guyana | 99.6 /100 | #83 | Exceptional 65.5% |
Demographics Similar to Immigrants from England by Family Households
In terms of family households, the demographic groups most similar to Immigrants from England are British (64.4%, a difference of 0.010%), Chickasaw (64.4%, a difference of 0.020%), Immigrants from Moldova (64.4%, a difference of 0.040%), Immigrants from Nigeria (64.4%, a difference of 0.040%), and Immigrants from Southern Europe (64.4%, a difference of 0.040%).
| Demographics | Rating | Rank | Family Households |
| Austrians | 68.5 /100 | #154 | Good 64.5% |
| Uruguayans | 67.7 /100 | #155 | Good 64.5% |
| Czechs | 67.0 /100 | #156 | Good 64.5% |
| Canadians | 66.6 /100 | #157 | Good 64.4% |
| Lebanese | 66.4 /100 | #158 | Good 64.4% |
| Germans | 65.8 /100 | #159 | Good 64.4% |
| Immigrants | Moldova | 65.2 /100 | #160 | Good 64.4% |
| Immigrants | England | 62.6 /100 | #161 | Good 64.4% |
| British | 61.6 /100 | #162 | Good 64.4% |
| Chickasaw | 61.5 /100 | #163 | Good 64.4% |
| Immigrants | Nigeria | 60.1 /100 | #164 | Good 64.4% |
| Immigrants | Southern Europe | 60.0 /100 | #165 | Good 64.4% |
| Scotch-Irish | 59.2 /100 | #166 | Average 64.4% |
| Irish | 57.9 /100 | #167 | Average 64.4% |
| Hondurans | 57.5 /100 | #168 | Average 64.4% |