Immigrants from Austria vs Immigrants from West Indies Average Family Size
COMPARE
Immigrants from Austria
Immigrants from West Indies
Average Family Size
Average Family Size Comparison
Immigrants from Austria
Immigrants from West Indies
3.12
AVERAGE FAMILY SIZE
0.0/ 100
METRIC RATING
321st/ 347
METRIC RANK
3.33
AVERAGE FAMILY SIZE
99.9/ 100
METRIC RATING
71st/ 347
METRIC RANK
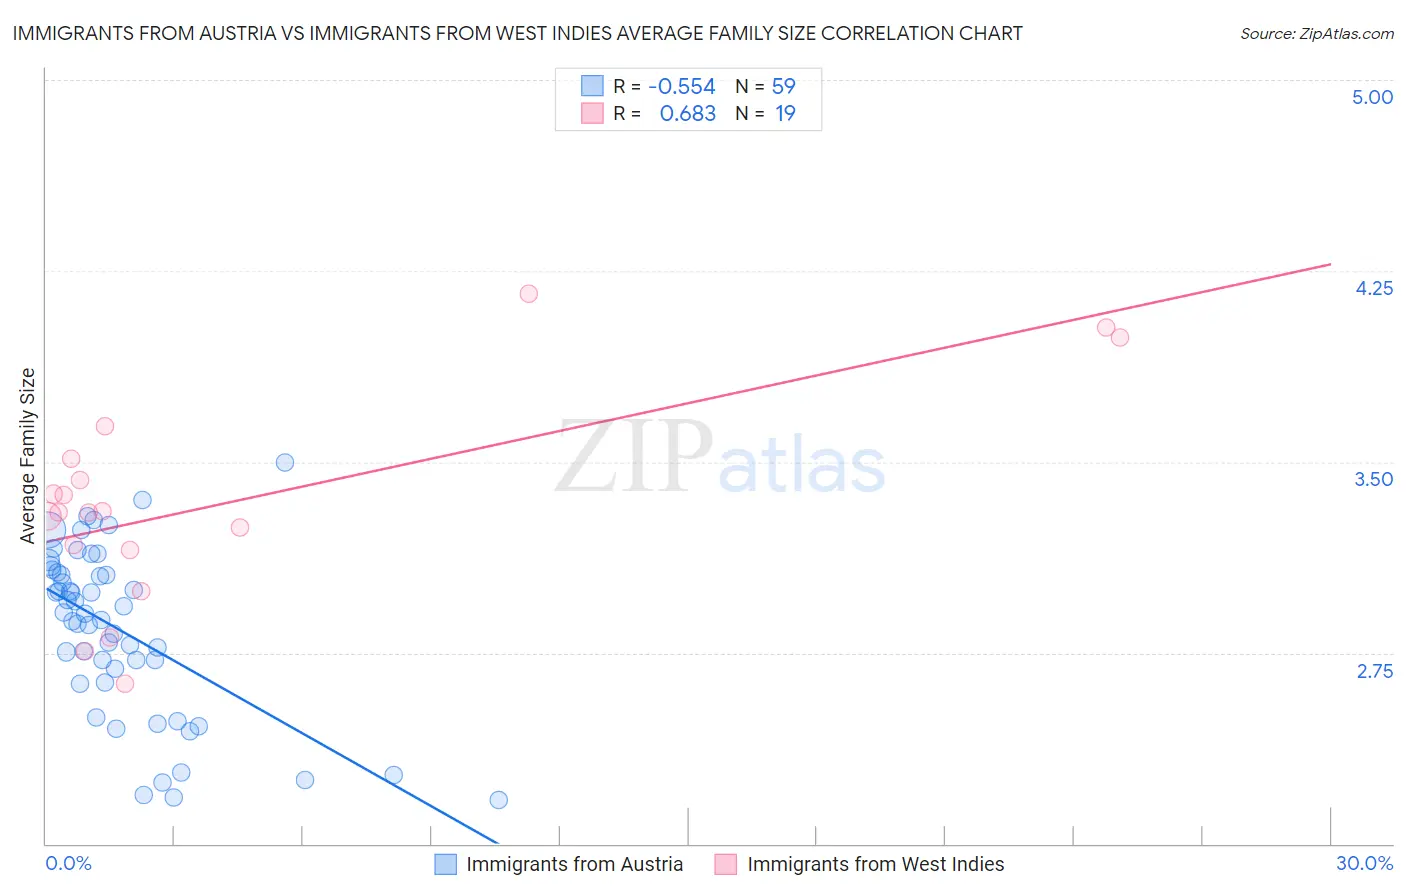
Immigrants from Austria vs Immigrants from West Indies Average Family Size Correlation Chart
The statistical analysis conducted on geographies consisting of 167,966,875 people shows a substantial negative correlation between the proportion of Immigrants from Austria and average family size in the United States with a correlation coefficient (R) of -0.554 and weighted average of 3.12. Similarly, the statistical analysis conducted on geographies consisting of 72,454,628 people shows a significant positive correlation between the proportion of Immigrants from West Indies and average family size in the United States with a correlation coefficient (R) of 0.683 and weighted average of 3.33, a difference of 6.8%.
Average Family Size Correlation Summary
| Measurement | Immigrants from Austria | Immigrants from West Indies |
| Minimum | 2.17 | 2.63 |
| Maximum | 3.50 | 4.16 |
| Range | 1.33 | 1.53 |
| Mean | 2.84 | 3.34 |
| Median | 2.90 | 3.30 |
| Interquartile 25% (IQ1) | 2.64 | 3.15 |
| Interquartile 75% (IQ3) | 3.06 | 3.51 |
| Interquartile Range (IQR) | 0.43 | 0.36 |
| Standard Deviation (Sample) | 0.33 | 0.41 |
| Standard Deviation (Population) | 0.32 | 0.40 |
Similar Demographics by Average Family Size
Demographics Similar to Immigrants from Austria by Average Family Size
In terms of average family size, the demographic groups most similar to Immigrants from Austria are Immigrants from Canada (3.12, a difference of 0.0%), Immigrants from North America (3.12, a difference of 0.030%), Soviet Union (3.11, a difference of 0.030%), Eastern European (3.12, a difference of 0.10%), and Welsh (3.12, a difference of 0.10%).
| Demographics | Rating | Rank | Average Family Size |
| Russians | 0.1 /100 | #314 | Tragic 3.12 |
| Immigrants | Scotland | 0.1 /100 | #315 | Tragic 3.12 |
| Serbians | 0.1 /100 | #316 | Tragic 3.12 |
| Italians | 0.1 /100 | #317 | Tragic 3.12 |
| Eastern Europeans | 0.1 /100 | #318 | Tragic 3.12 |
| Welsh | 0.1 /100 | #319 | Tragic 3.12 |
| Immigrants | North America | 0.0 /100 | #320 | Tragic 3.12 |
| Immigrants | Austria | 0.0 /100 | #321 | Tragic 3.12 |
| Immigrants | Canada | 0.0 /100 | #322 | Tragic 3.12 |
| Soviet Union | 0.0 /100 | #323 | Tragic 3.11 |
| Celtics | 0.0 /100 | #324 | Tragic 3.11 |
| English | 0.0 /100 | #325 | Tragic 3.11 |
| Ottawa | 0.0 /100 | #326 | Tragic 3.11 |
| Dutch | 0.0 /100 | #327 | Tragic 3.11 |
| Czechs | 0.0 /100 | #328 | Tragic 3.11 |
Demographics Similar to Immigrants from West Indies by Average Family Size
In terms of average family size, the demographic groups most similar to Immigrants from West Indies are Immigrants from Trinidad and Tobago (3.33, a difference of 0.010%), Immigrants (3.33, a difference of 0.060%), Immigrants from Caribbean (3.33, a difference of 0.070%), Immigrants from Cambodia (3.33, a difference of 0.090%), and Yaqui (3.32, a difference of 0.10%).
| Demographics | Rating | Rank | Average Family Size |
| Dominicans | 99.9 /100 | #64 | Exceptional 3.34 |
| Immigrants | Laos | 99.9 /100 | #65 | Exceptional 3.34 |
| Immigrants | St. Vincent and the Grenadines | 99.9 /100 | #66 | Exceptional 3.34 |
| Immigrants | Jamaica | 99.9 /100 | #67 | Exceptional 3.33 |
| Immigrants | Cambodia | 99.9 /100 | #68 | Exceptional 3.33 |
| Immigrants | Immigrants | 99.9 /100 | #69 | Exceptional 3.33 |
| Immigrants | Trinidad and Tobago | 99.9 /100 | #70 | Exceptional 3.33 |
| Immigrants | West Indies | 99.9 /100 | #71 | Exceptional 3.33 |
| Immigrants | Caribbean | 99.9 /100 | #72 | Exceptional 3.33 |
| Yaqui | 99.9 /100 | #73 | Exceptional 3.32 |
| Immigrants | Sierra Leone | 99.9 /100 | #74 | Exceptional 3.32 |
| Immigrants | Barbados | 99.8 /100 | #75 | Exceptional 3.32 |
| Trinidadians and Tobagonians | 99.8 /100 | #76 | Exceptional 3.32 |
| Immigrants | Ecuador | 99.8 /100 | #77 | Exceptional 3.32 |
| Immigrants | Micronesia | 99.8 /100 | #78 | Exceptional 3.32 |