Immigrants from Austria vs Macedonian Female Unemployment

COMPARE

Immigrants from Austria
Race
Ancestry
AfghanAfricanAlaska NativeAlaskan AthabascanAlbanianAleutAlsatianAmericanApacheArabArapahoArgentineanArmenianAssyrian/Chaldean/SyriacAustralianAustrianBahamianBangladeshiBarbadianBasqueBelgianBelizeanBermudanBhutaneseBlackfeetBolivianBrazilianBritishBritish West IndianBulgarianBurmeseCajunCambodianCanadianCape VerdeanCarpatho RusynCelticCentral AmericanCentral American IndianCherokeeCheyenneChickasawChileanChineseChippewaChoctawColombianColvilleComancheCosta RicanCreeCreekCroatianCrowCubanCypriotCzechCzechoslovakianDanishDelawareDominicanDutchDutch West IndianEastern EuropeanEcuadorianEgyptianEnglishEstonianEthiopianEuropeanFijianFilipinoFinnishFrenchFrench American IndianFrench CanadianGermanGerman RussianGhanaianGreekGuamanian/ChamorroGuatemalanGuyaneseHaitianHmongHonduranHopiHoumaHungarianIcelanderIndian (Asian)IndonesianInupiatIranianIraqiIrishIroquoisIsraeliItalianJamaicanJapaneseJordanianKenyanKiowaKoreanLaotianLatvianLebaneseLiberianLithuanianLumbeeLuxembourgerMalaysianMalteseMarshalleseMenomineeMexicanMexican American IndianMongolianMoroccanNative HawaiianNavajoNepaleseNew ZealanderNicaraguanNigerianNorthern EuropeanNorwegianOkinawanOsageOttawaPaiutePakistaniPalestinianPanamanianParaguayanPennsylvania GermanPeruvianPimaPolishPortuguesePotawatomiPuebloPuerto RicanPuget Sound SalishRomanianRussianSalvadoranSamoanScandinavianScotch-IrishScottishSeminoleSenegaleseSerbianShoshoneSierra LeoneanSiouxSlavicSlovakSloveneSomaliSouth AfricanSouth AmericanSouth American IndianSoviet UnionSpaniardSpanishSpanish AmericanSpanish American IndianSri LankanSubsaharan AfricanSudaneseSwedishSwissSyrianTaiwaneseThaiTlingit-HaidaTohono O'OdhamTonganTrinidadian and TobagonianTsimshianTurkishU.S. Virgin IslanderUgandanUkrainianUruguayanUteVenezuelanVietnameseWelshWest IndianYakamaYaquiYugoslavianYumanYup'ikZimbabwean
Immigration
NonimmigrantsImmigrantsAfghanistanAfricaAlbaniaArgentinaArmeniaAsiaAustraliaAustriaBahamasBangladeshBarbadosBelarusBelgiumBelizeBoliviaBosnia and HerzegovinaBrazilBulgariaBurma/MyanmarCabo VerdeCambodiaCameroonCanadaCaribbeanCentral AmericaChileChinaColombiaCongoCosta RicaCroatiaCubaCzechoslovakiaDenmarkDominicaDominican RepublicEastern AfricaEastern AsiaEastern EuropeEcuadorEgyptEl SalvadorEnglandEritreaEthiopiaEuropeFijiFranceGermanyGhanaGreeceGrenadaGuatemalaGuyanaHaitiHondurasHong KongHungaryIndiaIndonesiaIranIraqIrelandIsraelItalyJamaicaJapanJordanKazakhstanKenyaKoreaKuwaitLaosLatin AmericaLatviaLebanonLiberiaLithuaniaMalaysiaMexicoMicronesiaMiddle AfricaMoldovaMoroccoNepalNetherlandsNicaraguaNigeriaNorth AmericaNorth MacedoniaNorthern AfricaNorthern EuropeNorwayOceaniaPakistanPanamaPeruPhilippinesPolandPortugalRomaniaRussiaSaudi ArabiaScotlandSenegalSerbiaSierra LeoneSingaporeSomaliaSouth AfricaSouth AmericaSouth Central AsiaSouth Eastern AsiaSouthern EuropeSpainSri LankaSt. Vincent and the GrenadinesSudanSwedenSwitzerlandSyriaTaiwanThailandTrinidad and TobagoTurkeyUgandaUkraineUruguayUzbekistanVenezuelaVietnamWest IndiesWestern AfricaWestern AsiaWestern EuropeYemenZaireZimbabweAzores
Macedonian
Race
Ancestry
AfghanAfricanAlaska NativeAlaskan AthabascanAlbanianAleutAlsatianAmericanApacheArabArapahoArgentineanArmenianAssyrian/Chaldean/SyriacAustralianAustrianBahamianBangladeshiBarbadianBasqueBelgianBelizeanBermudanBhutaneseBlackfeetBolivianBrazilianBritishBritish West IndianBulgarianBurmeseCajunCambodianCanadianCape VerdeanCarpatho RusynCelticCentral AmericanCentral American IndianCherokeeCheyenneChickasawChileanChineseChippewaChoctawColombianColvilleComancheCosta RicanCreeCreekCroatianCrowCubanCypriotCzechCzechoslovakianDanishDelawareDominicanDutchDutch West IndianEastern EuropeanEcuadorianEgyptianEnglishEstonianEthiopianEuropeanFijianFilipinoFinnishFrenchFrench American IndianFrench CanadianGermanGerman RussianGhanaianGreekGuamanian/ChamorroGuatemalanGuyaneseHaitianHmongHonduranHopiHoumaHungarianIcelanderIndian (Asian)IndonesianInupiatIranianIraqiIrishIroquoisIsraeliItalianJamaicanJapaneseJordanianKenyanKiowaKoreanLaotianLatvianLebaneseLiberianLithuanianLumbeeLuxembourgerMacedonianMalaysianMalteseMarshalleseMenomineeMexicanMexican American IndianMongolianMoroccanNative HawaiianNavajoNepaleseNew ZealanderNicaraguanNigerianNorthern EuropeanNorwegianOkinawanOsageOttawaPaiutePakistaniPalestinianPanamanianParaguayanPennsylvania GermanPeruvianPimaPolishPortuguesePotawatomiPuebloPuerto RicanPuget Sound SalishRomanianRussianSalvadoranSamoanScandinavianScotch-IrishScottishSeminoleSenegaleseSerbianShoshoneSierra LeoneanSiouxSlavicSlovakSloveneSomaliSouth AfricanSouth AmericanSouth American IndianSoviet UnionSpaniardSpanishSpanish AmericanSpanish American IndianSri LankanSubsaharan AfricanSudaneseSwedishSwissSyrianTaiwaneseThaiTlingit-HaidaTohono O'OdhamTonganTrinidadian and TobagonianTsimshianTurkishU.S. Virgin IslanderUgandanUkrainianUruguayanUteVenezuelanVietnameseWelshWest IndianYakamaYaquiYugoslavianYumanYup'ikZimbabwean
Immigration
NonimmigrantsImmigrantsAfghanistanAfricaAlbaniaArgentinaArmeniaAsiaAustraliaBahamasBangladeshBarbadosBelarusBelgiumBelizeBoliviaBosnia and HerzegovinaBrazilBulgariaBurma/MyanmarCabo VerdeCambodiaCameroonCanadaCaribbeanCentral AmericaChileChinaColombiaCongoCosta RicaCroatiaCubaCzechoslovakiaDenmarkDominicaDominican RepublicEastern AfricaEastern AsiaEastern EuropeEcuadorEgyptEl SalvadorEnglandEritreaEthiopiaEuropeFijiFranceGermanyGhanaGreeceGrenadaGuatemalaGuyanaHaitiHondurasHong KongHungaryIndiaIndonesiaIranIraqIrelandIsraelItalyJamaicaJapanJordanKazakhstanKenyaKoreaKuwaitLaosLatin AmericaLatviaLebanonLiberiaLithuaniaMalaysiaMexicoMicronesiaMiddle AfricaMoldovaMoroccoNepalNetherlandsNicaraguaNigeriaNorth AmericaNorth MacedoniaNorthern AfricaNorthern EuropeNorwayOceaniaPakistanPanamaPeruPhilippinesPolandPortugalRomaniaRussiaSaudi ArabiaScotlandSenegalSerbiaSierra LeoneSingaporeSomaliaSouth AfricaSouth AmericaSouth Central AsiaSouth Eastern AsiaSouthern EuropeSpainSri LankaSt. Vincent and the GrenadinesSudanSwedenSwitzerlandSyriaTaiwanThailandTrinidad and TobagoTurkeyUgandaUkraineUruguayUzbekistanVenezuelaVietnamWest IndiesWestern AfricaWestern AsiaWestern EuropeYemenZaireZimbabweAzores
Female Unemployment
Income
Poverty
Unemployment
Labor Participation
Family Structure
Vehicle Availability
Education Level
Disability

Female Unemployment Comparison

Immigrants from Austria

Macedonians

Exceptional
Exceptional
5.0%
FEMALE UNEMPLOYMENT
95.7/ 100
METRIC RATING
93rd/ 347
METRIC RANK
5.1%
FEMALE UNEMPLOYMENT
92.4/ 100
METRIC RATING
110th/ 347
METRIC RANK

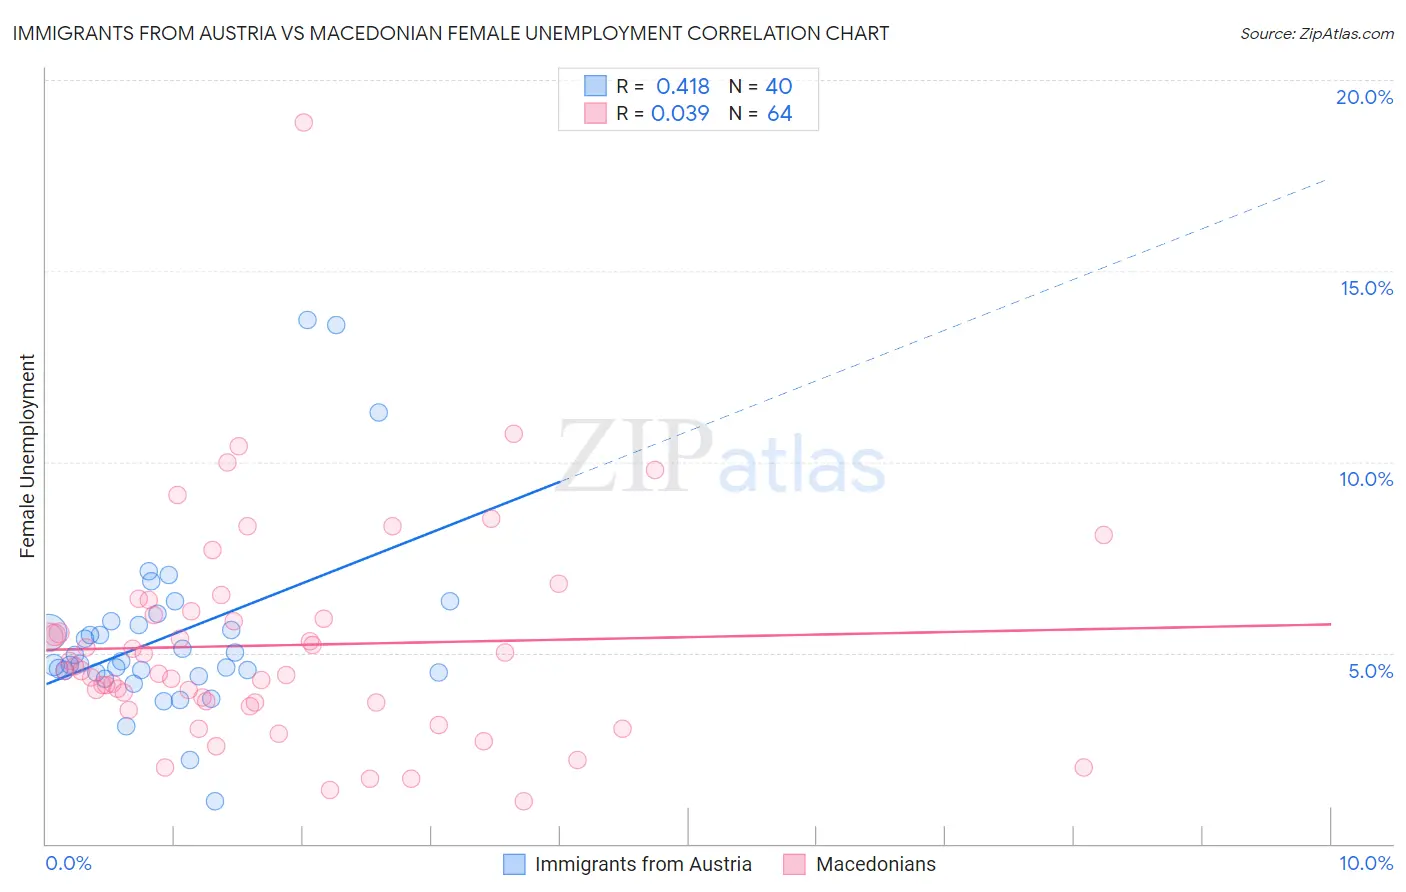
Immigrants from Austria vs Macedonian Female Unemployment Correlation Chart

The statistical analysis conducted on geographies consisting of 167,645,945 people shows a moderate positive correlation between the proportion of Immigrants from Austria and unemploymnet rate among females in the United States with a correlation coefficient (R) of 0.418 and weighted average of 5.0%. Similarly, the statistical analysis conducted on geographies consisting of 132,466,796 people shows no correlation between the proportion of Macedonians and unemploymnet rate among females in the United States with a correlation coefficient (R) of 0.039 and weighted average of 5.1%, a difference of 0.97%.
Immigrants from Austria vs Macedonian Female Unemployment

Female Unemployment Correlation Summary

MeasurementImmigrants from AustriaMacedonian
Minimum1.1%1.1%
Maximum13.7%18.9%
Range12.6%17.8%
Mean5.5%5.2%
Median4.8%4.5%
Interquartile 25% (IQ1)4.5%3.7%
Interquartile 75% (IQ3)5.8%6.0%
Interquartile Range (IQR)1.3%2.3%
Standard Deviation (Sample)2.5%2.8%
Standard Deviation (Population)2.4%2.8%

Demographics Similar to Immigrants from Austria and Macedonians by Female Unemployment

In terms of female unemployment, the demographic groups most similar to Immigrants from Austria are Immigrants from Malaysia (5.0%, a difference of 0.020%), Burmese (5.0%, a difference of 0.040%), Romanian (5.0%, a difference of 0.080%), Immigrants from South Central Asia (5.0%, a difference of 0.090%), and Immigrants from Japan (5.0%, a difference of 0.10%). Similarly, the demographic groups most similar to Macedonians are Immigrants from Burma/Myanmar (5.1%, a difference of 0.030%), Immigrants from Eastern Africa (5.1%, a difference of 0.10%), Puget Sound Salish (5.1%, a difference of 0.14%), Immigrants from Switzerland (5.1%, a difference of 0.17%), and Paraguayan (5.1%, a difference of 0.19%).
DemographicsRating | RankFemale Unemployment
Immigrants | Japan
96.0
/100
|
#91
Exceptional
5.0%
Romanians
95.9
/100
|
#92
Exceptional
5.0%
Immigrants | Austria
95.7
/100
|
#93
Exceptional
5.0%
Immigrants | Malaysia
95.7
/100
|
#94
Exceptional
5.0%
Burmese
95.6
/100
|
#95
Exceptional
5.0%
Immigrants | South Central Asia
95.5
/100
|
#96
Exceptional
5.0%
Immigrants | Somalia
95.2
/100
|
#97
Exceptional
5.0%
Immigrants | Kuwait
95.2
/100
|
#98
Exceptional
5.0%
Immigrants | Zaire
95.2
/100
|
#99
Exceptional
5.0%
Indonesians
95.1
/100
|
#100
Exceptional
5.0%
Immigrants | Czechoslovakia
95.0
/100
|
#101
Exceptional
5.0%
Immigrants | Kenya
94.8
/100
|
#102
Exceptional
5.0%
Somalis
94.6
/100
|
#103
Exceptional
5.0%
Kenyans
93.7
/100
|
#104
Exceptional
5.0%
Immigrants | England
93.6
/100
|
#105
Exceptional
5.0%
Paraguayans
93.2
/100
|
#106
Exceptional
5.1%
Immigrants | Switzerland
93.1
/100
|
#107
Exceptional
5.1%
Puget Sound Salish
93.0
/100
|
#108
Exceptional
5.1%
Immigrants | Eastern Africa
92.8
/100
|
#109
Exceptional
5.1%
Macedonians
92.4
/100
|
#110
Exceptional
5.1%
Immigrants | Burma/Myanmar
92.3
/100
|
#111
Exceptional
5.1%