Immigrants from Austria vs Macedonian Unemployment Among Women with Children Under 18 years
COMPARE
Immigrants from Austria
Macedonian
Unemployment Among Women with Children Under 18 years
Unemployment Among Women with Children Under 18 years Comparison
Immigrants from Austria
Macedonians
5.3%
UNEMPLOYMENT AMONG WOMEN WITH CHILDREN UNDER 18 YEARS
82.1/ 100
METRIC RATING
130th/ 347
METRIC RANK
5.3%
UNEMPLOYMENT AMONG WOMEN WITH CHILDREN UNDER 18 YEARS
87.7/ 100
METRIC RATING
116th/ 347
METRIC RANK
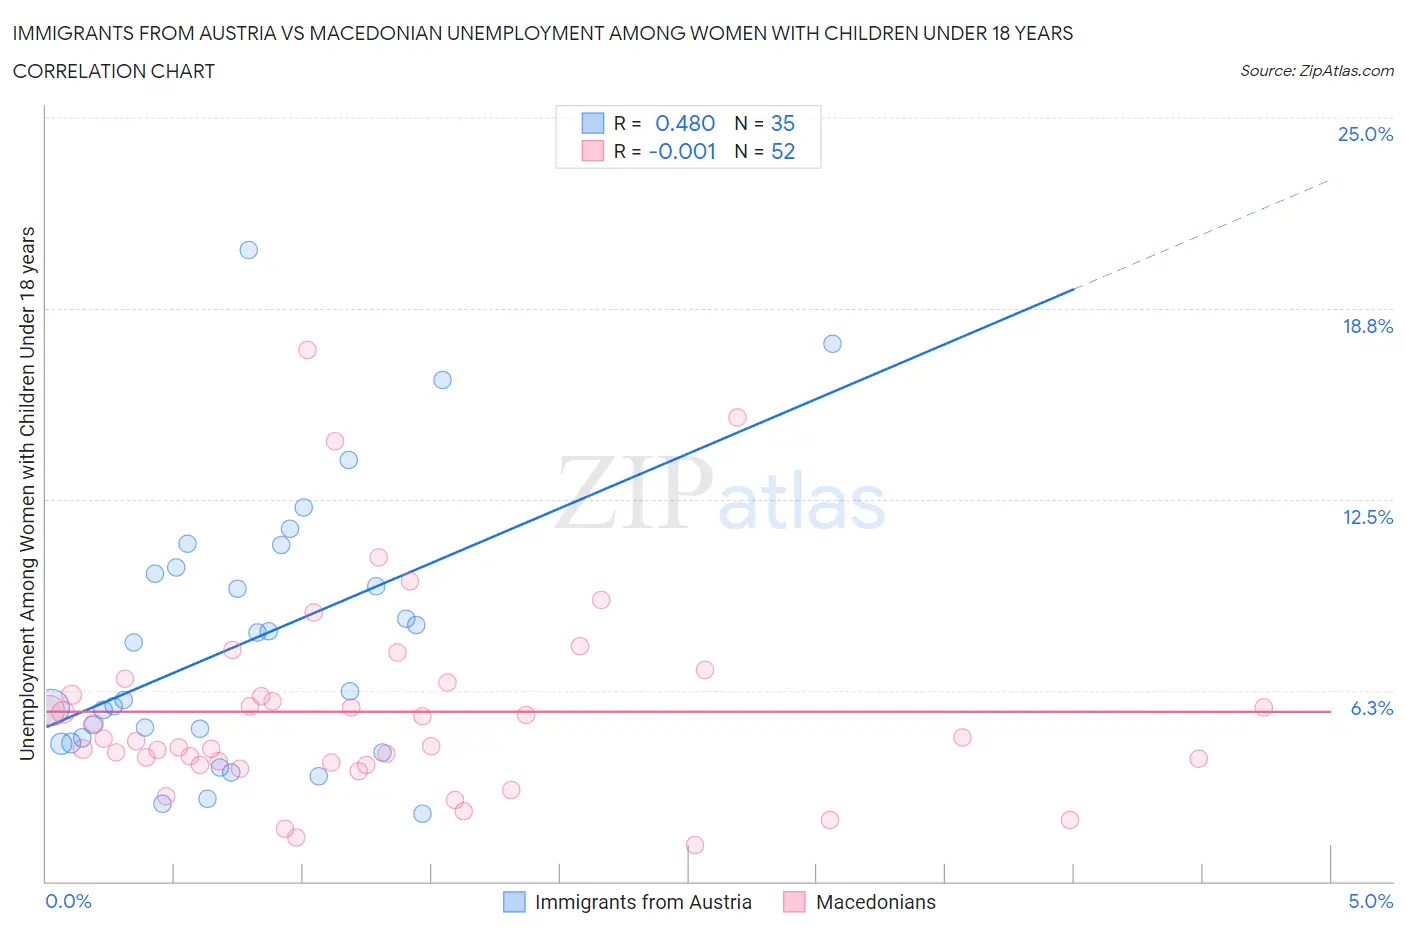
Immigrants from Austria vs Macedonian Unemployment Among Women with Children Under 18 years Correlation Chart
The statistical analysis conducted on geographies consisting of 164,309,482 people shows a moderate positive correlation between the proportion of Immigrants from Austria and unemployment rate among women with children under the age of 18 in the United States with a correlation coefficient (R) of 0.480 and weighted average of 5.3%. Similarly, the statistical analysis conducted on geographies consisting of 130,061,187 people shows no correlation between the proportion of Macedonians and unemployment rate among women with children under the age of 18 in the United States with a correlation coefficient (R) of -0.001 and weighted average of 5.3%, a difference of 0.81%.
Unemployment Among Women with Children Under 18 years Correlation Summary
| Measurement | Immigrants from Austria | Macedonian |
| Minimum | 2.2% | 1.2% |
| Maximum | 20.7% | 17.4% |
| Range | 18.5% | 16.2% |
| Mean | 7.9% | 5.5% |
| Median | 6.2% | 4.6% |
| Interquartile 25% (IQ1) | 4.5% | 3.9% |
| Interquartile 75% (IQ3) | 10.3% | 6.3% |
| Interquartile Range (IQR) | 5.7% | 2.4% |
| Standard Deviation (Sample) | 4.4% | 3.3% |
| Standard Deviation (Population) | 4.4% | 3.2% |
Demographics Similar to Immigrants from Austria and Macedonians by Unemployment Among Women with Children Under 18 years
In terms of unemployment among women with children under 18 years, the demographic groups most similar to Immigrants from Austria are Immigrants from Israel (5.3%, a difference of 0.020%), Immigrants from Italy (5.3%, a difference of 0.030%), Immigrants from South Africa (5.3%, a difference of 0.090%), Immigrants from Ethiopia (5.3%, a difference of 0.090%), and White/Caucasian (5.3%, a difference of 0.10%). Similarly, the demographic groups most similar to Macedonians are Canadian (5.3%, a difference of 0.060%), Hungarian (5.3%, a difference of 0.070%), Kenyan (5.3%, a difference of 0.080%), French (5.2%, a difference of 0.12%), and Immigrants from Europe (5.3%, a difference of 0.16%).
| Demographics | Rating | Rank | Unemployment Among Women with Children Under 18 years |
| French | 88.4 /100 | #113 | Excellent 5.2% |
| Kenyans | 88.2 /100 | #114 | Excellent 5.3% |
| Hungarians | 88.1 /100 | #115 | Excellent 5.3% |
| Macedonians | 87.7 /100 | #116 | Excellent 5.3% |
| Canadians | 87.4 /100 | #117 | Excellent 5.3% |
| Immigrants | Europe | 86.7 /100 | #118 | Excellent 5.3% |
| Basques | 86.5 /100 | #119 | Excellent 5.3% |
| Egyptians | 86.4 /100 | #120 | Excellent 5.3% |
| Immigrants | Romania | 85.8 /100 | #121 | Excellent 5.3% |
| Scotch-Irish | 85.7 /100 | #122 | Excellent 5.3% |
| Sudanese | 84.3 /100 | #123 | Excellent 5.3% |
| Native Hawaiians | 84.0 /100 | #124 | Excellent 5.3% |
| Immigrants | North Macedonia | 83.2 /100 | #125 | Excellent 5.3% |
| Immigrants | Oceania | 83.1 /100 | #126 | Excellent 5.3% |
| Whites/Caucasians | 82.9 /100 | #127 | Excellent 5.3% |
| Immigrants | South Africa | 82.8 /100 | #128 | Excellent 5.3% |
| Immigrants | Italy | 82.3 /100 | #129 | Excellent 5.3% |
| Immigrants | Austria | 82.1 /100 | #130 | Excellent 5.3% |
| Immigrants | Israel | 81.9 /100 | #131 | Excellent 5.3% |
| Immigrants | Ethiopia | 81.4 /100 | #132 | Excellent 5.3% |
| Ethiopians | 80.7 /100 | #133 | Excellent 5.3% |