Immigrants from Albania vs Cajun Married-couple Households
COMPARE
Immigrants from Albania
Cajun
Married-couple Households
Married-couple Households Comparison
Immigrants from Albania
Cajuns
44.4%
MARRIED-COUPLE HOUSEHOLDS
1.0/ 100
METRIC RATING
242nd/ 347
METRIC RANK
46.4%
MARRIED-COUPLE HOUSEHOLDS
45.2/ 100
METRIC RATING
176th/ 347
METRIC RANK
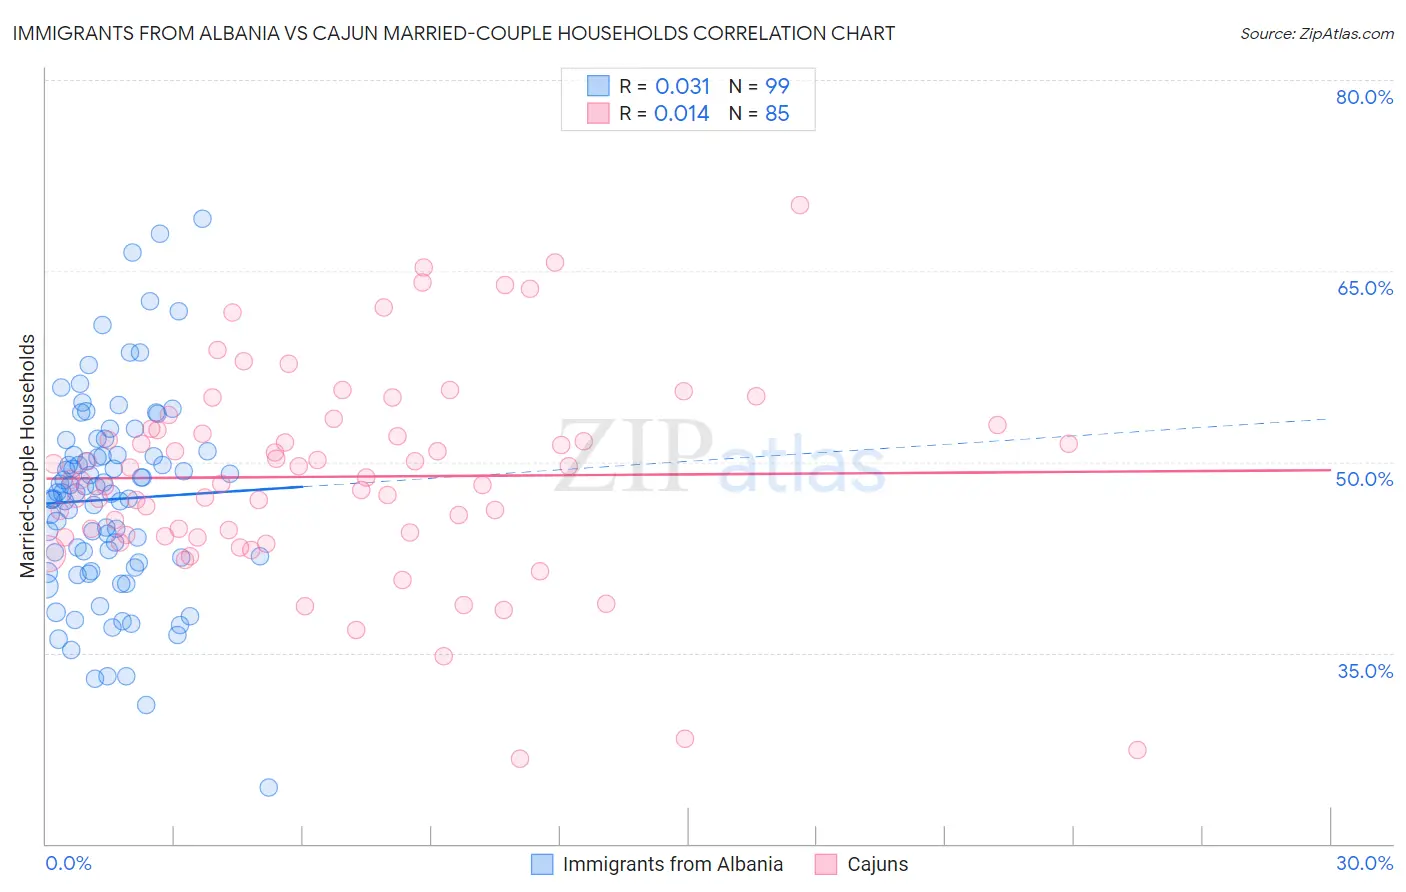
Immigrants from Albania vs Cajun Married-couple Households Correlation Chart
The statistical analysis conducted on geographies consisting of 119,383,494 people shows no correlation between the proportion of Immigrants from Albania and percentage of married-couple family households in the United States with a correlation coefficient (R) of 0.031 and weighted average of 44.4%. Similarly, the statistical analysis conducted on geographies consisting of 149,695,454 people shows no correlation between the proportion of Cajuns and percentage of married-couple family households in the United States with a correlation coefficient (R) of 0.014 and weighted average of 46.4%, a difference of 4.3%.
Married-couple Households Correlation Summary
| Measurement | Immigrants from Albania | Cajun |
| Minimum | 24.4% | 26.7% |
| Maximum | 69.1% | 70.1% |
| Range | 44.7% | 43.5% |
| Mean | 47.0% | 48.8% |
| Median | 47.6% | 48.6% |
| Interquartile 25% (IQ1) | 42.1% | 44.2% |
| Interquartile 75% (IQ3) | 50.5% | 52.6% |
| Interquartile Range (IQR) | 8.4% | 8.4% |
| Standard Deviation (Sample) | 7.9% | 8.0% |
| Standard Deviation (Population) | 7.8% | 8.0% |
Similar Demographics by Married-couple Households
Demographics Similar to Immigrants from Albania by Married-couple Households
In terms of married-couple households, the demographic groups most similar to Immigrants from Albania are Ute (44.4%, a difference of 0.040%), Immigrants from Bosnia and Herzegovina (44.4%, a difference of 0.040%), Immigrants from Saudi Arabia (44.4%, a difference of 0.070%), Spanish American (44.5%, a difference of 0.12%), and Immigrants from Uruguay (44.5%, a difference of 0.14%).
| Demographics | Rating | Rank | Married-couple Households |
| Immigrants | Nicaragua | 1.2 /100 | #235 | Tragic 44.5% |
| Yaqui | 1.2 /100 | #236 | Tragic 44.5% |
| Comanche | 1.2 /100 | #237 | Tragic 44.5% |
| Immigrants | Uruguay | 1.1 /100 | #238 | Tragic 44.5% |
| Spanish Americans | 1.1 /100 | #239 | Tragic 44.5% |
| Ute | 1.0 /100 | #240 | Tragic 44.4% |
| Immigrants | Bosnia and Herzegovina | 1.0 /100 | #241 | Tragic 44.4% |
| Immigrants | Albania | 1.0 /100 | #242 | Tragic 44.4% |
| Immigrants | Saudi Arabia | 0.9 /100 | #243 | Tragic 44.4% |
| Immigrants | Armenia | 0.7 /100 | #244 | Tragic 44.3% |
| Immigrants | El Salvador | 0.7 /100 | #245 | Tragic 44.3% |
| Immigrants | Cuba | 0.6 /100 | #246 | Tragic 44.2% |
| Immigrants | Morocco | 0.6 /100 | #247 | Tragic 44.2% |
| Yup'ik | 0.4 /100 | #248 | Tragic 44.1% |
| Immigrants | Kenya | 0.4 /100 | #249 | Tragic 44.1% |
Demographics Similar to Cajuns by Married-couple Households
In terms of married-couple households, the demographic groups most similar to Cajuns are Immigrants from Colombia (46.4%, a difference of 0.030%), Immigrants (46.3%, a difference of 0.060%), Immigrants from Costa Rica (46.3%, a difference of 0.070%), Immigrants from Zimbabwe (46.3%, a difference of 0.090%), and Mongolian (46.3%, a difference of 0.12%).
| Demographics | Rating | Rank | Married-couple Households |
| Spanish American Indians | 59.4 /100 | #169 | Average 46.6% |
| South Americans | 58.0 /100 | #170 | Average 46.6% |
| Immigrants | Chile | 55.7 /100 | #171 | Average 46.5% |
| Immigrants | Australia | 54.6 /100 | #172 | Average 46.5% |
| Immigrants | Norway | 52.0 /100 | #173 | Average 46.5% |
| Immigrants | Mexico | 50.0 /100 | #174 | Average 46.4% |
| Immigrants | Colombia | 46.1 /100 | #175 | Average 46.4% |
| Cajuns | 45.2 /100 | #176 | Average 46.4% |
| Immigrants | Immigrants | 43.8 /100 | #177 | Average 46.3% |
| Immigrants | Costa Rica | 43.4 /100 | #178 | Average 46.3% |
| Immigrants | Zimbabwe | 43.0 /100 | #179 | Average 46.3% |
| Mongolians | 42.0 /100 | #180 | Average 46.3% |
| Malaysians | 41.8 /100 | #181 | Average 46.3% |
| Yugoslavians | 38.9 /100 | #182 | Fair 46.2% |
| Immigrants | Brazil | 38.3 /100 | #183 | Fair 46.2% |