Immigrants from Africa vs Immigrants from France Receiving Food Stamps
COMPARE
Immigrants from Africa
Immigrants from France
Receiving Food Stamps
Receiving Food Stamps Comparison
Immigrants from Africa
Immigrants from France
12.8%
RECEIVING FOOD STAMPS
7.6/ 100
METRIC RATING
214th/ 347
METRIC RANK
10.1%
RECEIVING FOOD STAMPS
98.3/ 100
METRIC RATING
89th/ 347
METRIC RANK
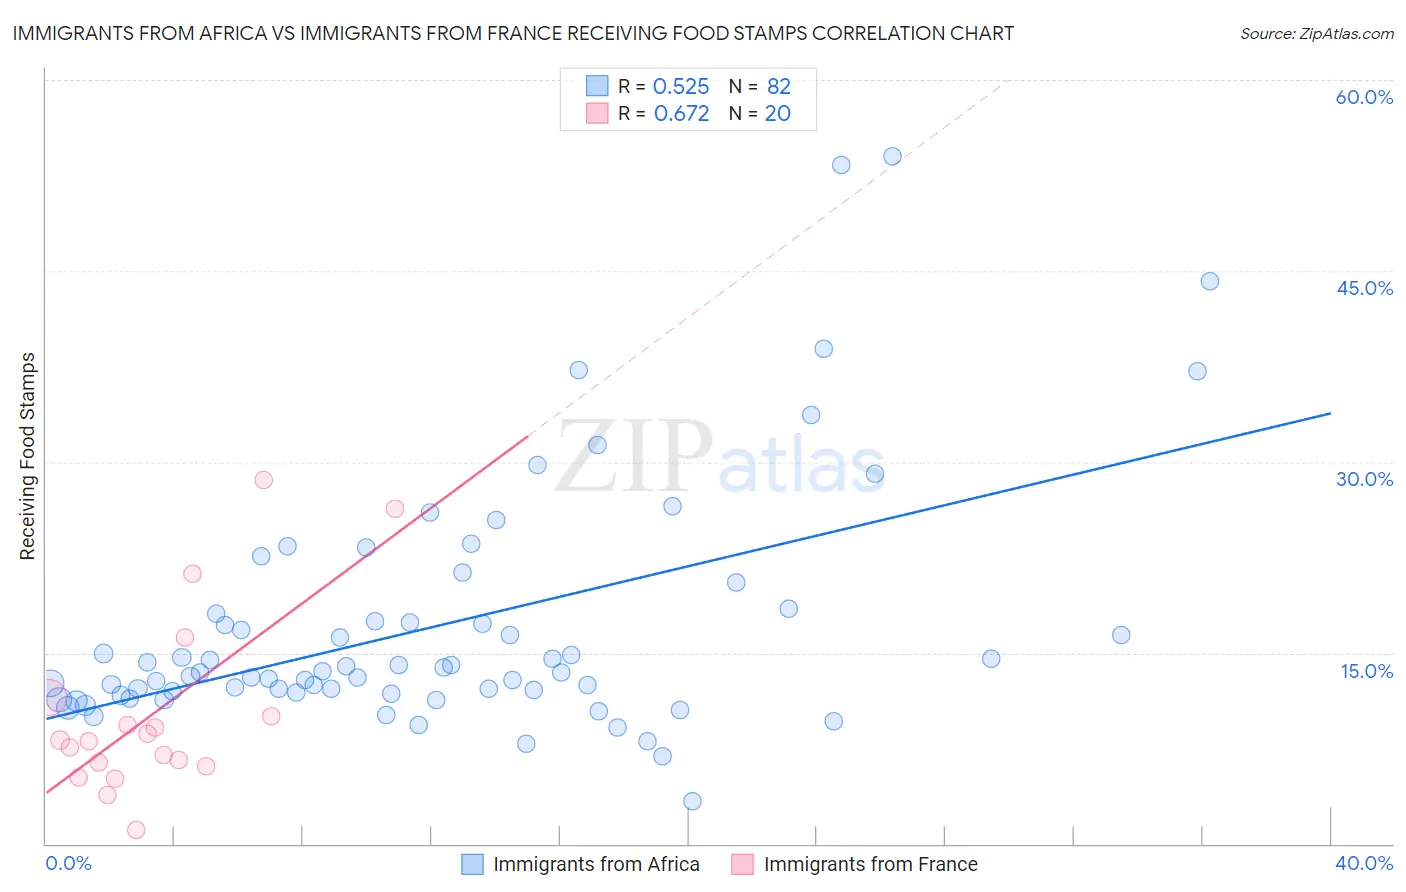
Immigrants from Africa vs Immigrants from France Receiving Food Stamps Correlation Chart
The statistical analysis conducted on geographies consisting of 467,597,829 people shows a substantial positive correlation between the proportion of Immigrants from Africa and percentage of population receiving government assistance and/or food stamps in the United States with a correlation coefficient (R) of 0.525 and weighted average of 12.8%. Similarly, the statistical analysis conducted on geographies consisting of 287,189,071 people shows a significant positive correlation between the proportion of Immigrants from France and percentage of population receiving government assistance and/or food stamps in the United States with a correlation coefficient (R) of 0.672 and weighted average of 10.1%, a difference of 26.8%.
Receiving Food Stamps Correlation Summary
| Measurement | Immigrants from Africa | Immigrants from France |
| Minimum | 3.3% | 1.1% |
| Maximum | 54.0% | 28.6% |
| Range | 50.7% | 27.5% |
| Mean | 17.1% | 10.3% |
| Median | 13.5% | 8.1% |
| Interquartile 25% (IQ1) | 11.9% | 6.2% |
| Interquartile 75% (IQ3) | 18.1% | 10.8% |
| Interquartile Range (IQR) | 6.2% | 4.5% |
| Standard Deviation (Sample) | 9.7% | 7.3% |
| Standard Deviation (Population) | 9.6% | 7.1% |
Similar Demographics by Receiving Food Stamps
Demographics Similar to Immigrants from Africa by Receiving Food Stamps
In terms of receiving food stamps, the demographic groups most similar to Immigrants from Africa are Moroccan (12.8%, a difference of 0.030%), Malaysian (12.7%, a difference of 0.43%), Native Hawaiian (12.8%, a difference of 0.44%), Immigrants from South America (12.8%, a difference of 0.55%), and Immigrants from Burma/Myanmar (12.9%, a difference of 0.81%).
| Demographics | Rating | Rank | Receiving Food Stamps |
| South Americans | 16.0 /100 | #207 | Poor 12.4% |
| Potawatomi | 14.6 /100 | #208 | Poor 12.5% |
| Immigrants | Sierra Leone | 12.9 /100 | #209 | Poor 12.5% |
| Immigrants | Uruguay | 12.8 /100 | #210 | Poor 12.5% |
| Colombians | 10.2 /100 | #211 | Poor 12.6% |
| Malaysians | 8.5 /100 | #212 | Tragic 12.7% |
| Moroccans | 7.6 /100 | #213 | Tragic 12.8% |
| Immigrants | Africa | 7.6 /100 | #214 | Tragic 12.8% |
| Native Hawaiians | 6.7 /100 | #215 | Tragic 12.8% |
| Immigrants | South America | 6.5 /100 | #216 | Tragic 12.8% |
| Immigrants | Burma/Myanmar | 6.0 /100 | #217 | Tragic 12.9% |
| Hawaiians | 5.4 /100 | #218 | Tragic 12.9% |
| Immigrants | Middle Africa | 5.4 /100 | #219 | Tragic 12.9% |
| Immigrants | Colombia | 5.3 /100 | #220 | Tragic 12.9% |
| Bermudans | 4.8 /100 | #221 | Tragic 13.0% |
Demographics Similar to Immigrants from France by Receiving Food Stamps
In terms of receiving food stamps, the demographic groups most similar to Immigrants from France are Immigrants from Kuwait (10.0%, a difference of 0.25%), Egyptian (10.0%, a difference of 0.31%), Immigrants from Norway (10.0%, a difference of 0.34%), Immigrants from Romania (10.0%, a difference of 0.44%), and Immigrants from Israel (10.0%, a difference of 0.62%).
| Demographics | Rating | Rank | Receiving Food Stamps |
| Austrians | 98.6 /100 | #82 | Exceptional 10.0% |
| Dutch | 98.6 /100 | #83 | Exceptional 10.0% |
| Immigrants | Israel | 98.5 /100 | #84 | Exceptional 10.0% |
| Immigrants | Romania | 98.5 /100 | #85 | Exceptional 10.0% |
| Immigrants | Norway | 98.4 /100 | #86 | Exceptional 10.0% |
| Egyptians | 98.4 /100 | #87 | Exceptional 10.0% |
| Immigrants | Kuwait | 98.4 /100 | #88 | Exceptional 10.0% |
| Immigrants | France | 98.3 /100 | #89 | Exceptional 10.1% |
| Finns | 97.9 /100 | #90 | Exceptional 10.2% |
| Jordanians | 97.9 /100 | #91 | Exceptional 10.2% |
| Irish | 97.9 /100 | #92 | Exceptional 10.2% |
| Belgians | 97.7 /100 | #93 | Exceptional 10.2% |
| Immigrants | Greece | 97.4 /100 | #94 | Exceptional 10.3% |
| Basques | 97.4 /100 | #95 | Exceptional 10.3% |
| Welsh | 97.3 /100 | #96 | Exceptional 10.3% |