Immigrants from Afghanistan vs Cree Currently Married
COMPARE
Immigrants from Afghanistan
Cree
Currently Married
Currently Married Comparison
Immigrants from Afghanistan
Cree
46.8%
CURRENTLY MARRIED
58.2/ 100
METRIC RATING
168th/ 347
METRIC RANK
44.9%
CURRENTLY MARRIED
1.7/ 100
METRIC RATING
229th/ 347
METRIC RANK
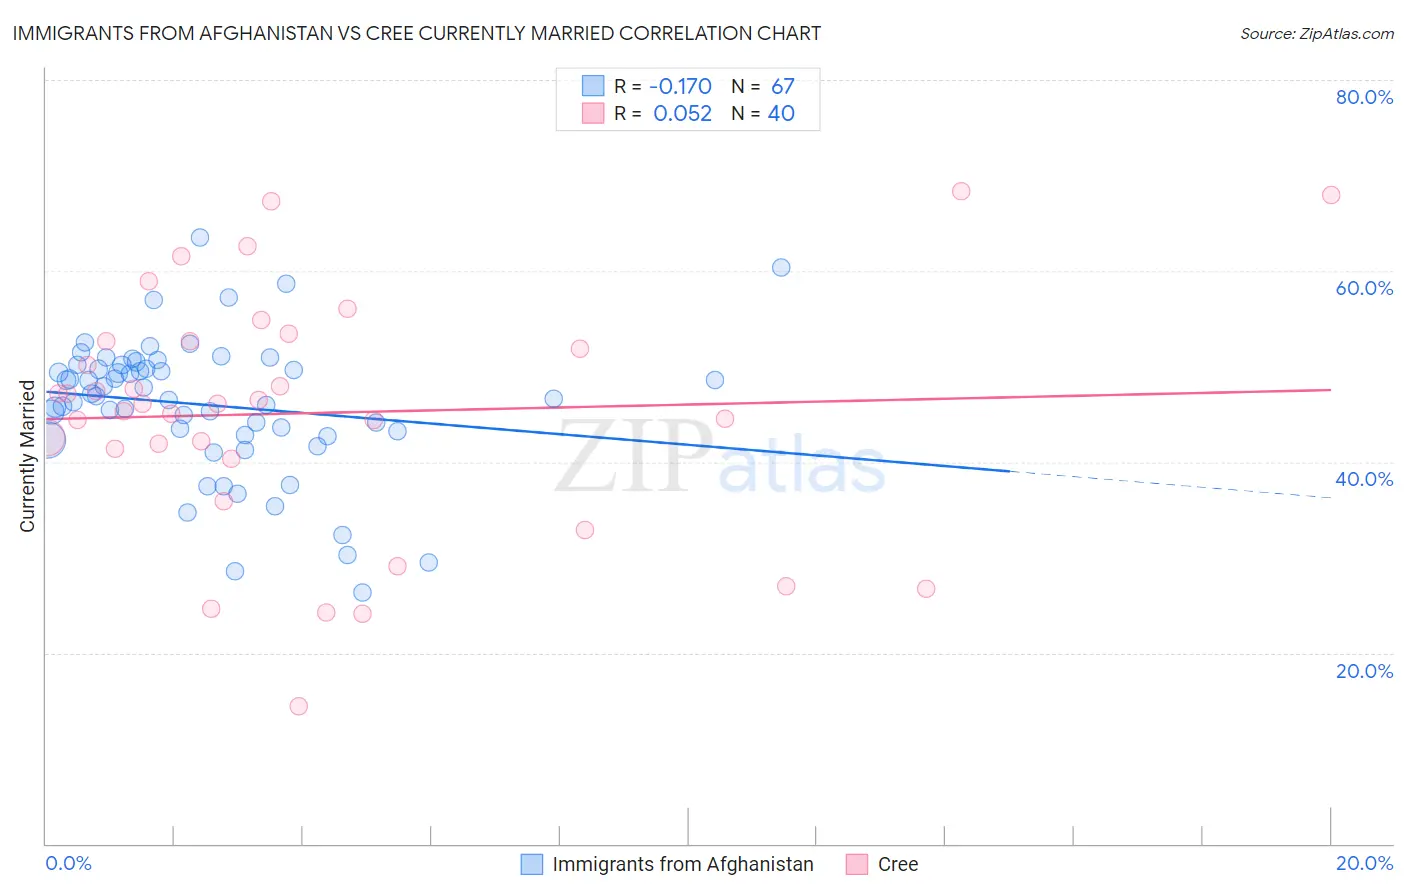
Immigrants from Afghanistan vs Cree Currently Married Correlation Chart
The statistical analysis conducted on geographies consisting of 147,642,585 people shows a poor negative correlation between the proportion of Immigrants from Afghanistan and percentage of population currently married in the United States with a correlation coefficient (R) of -0.170 and weighted average of 46.8%. Similarly, the statistical analysis conducted on geographies consisting of 76,211,685 people shows a slight positive correlation between the proportion of Cree and percentage of population currently married in the United States with a correlation coefficient (R) of 0.052 and weighted average of 44.9%, a difference of 4.2%.
Currently Married Correlation Summary
| Measurement | Immigrants from Afghanistan | Cree |
| Minimum | 26.3% | 14.4% |
| Maximum | 63.5% | 68.3% |
| Range | 37.2% | 53.9% |
| Mean | 46.0% | 45.1% |
| Median | 46.9% | 46.1% |
| Interquartile 25% (IQ1) | 42.8% | 40.8% |
| Interquartile 75% (IQ3) | 50.1% | 52.6% |
| Interquartile Range (IQR) | 7.3% | 11.8% |
| Standard Deviation (Sample) | 7.2% | 12.7% |
| Standard Deviation (Population) | 7.2% | 12.5% |
Similar Demographics by Currently Married
Demographics Similar to Immigrants from Afghanistan by Currently Married
In terms of currently married, the demographic groups most similar to Immigrants from Afghanistan are Armenian (46.8%, a difference of 0.0%), Spaniard (46.8%, a difference of 0.020%), Immigrants from Syria (46.8%, a difference of 0.040%), Samoan (46.8%, a difference of 0.060%), and Immigrants from Latvia (46.7%, a difference of 0.060%).
| Demographics | Rating | Rank | Currently Married |
| Immigrants | Southern Europe | 65.9 /100 | #161 | Good 46.9% |
| Immigrants | Nonimmigrants | 65.4 /100 | #162 | Good 46.9% |
| Delaware | 64.7 /100 | #163 | Good 46.9% |
| Immigrants | Western Asia | 64.2 /100 | #164 | Good 46.9% |
| Samoans | 59.8 /100 | #165 | Average 46.8% |
| Immigrants | Syria | 59.3 /100 | #166 | Average 46.8% |
| Spaniards | 58.8 /100 | #167 | Average 46.8% |
| Immigrants | Afghanistan | 58.2 /100 | #168 | Average 46.8% |
| Armenians | 58.2 /100 | #169 | Average 46.8% |
| Immigrants | Latvia | 56.7 /100 | #170 | Average 46.7% |
| Immigrants | Zimbabwe | 52.4 /100 | #171 | Average 46.7% |
| Aleuts | 52.0 /100 | #172 | Average 46.7% |
| Tlingit-Haida | 51.2 /100 | #173 | Average 46.7% |
| Peruvians | 50.0 /100 | #174 | Average 46.6% |
| Immigrants | Brazil | 49.9 /100 | #175 | Average 46.6% |
Demographics Similar to Cree by Currently Married
In terms of currently married, the demographic groups most similar to Cree are Immigrants from Kenya (44.9%, a difference of 0.040%), Immigrants from Panama (44.9%, a difference of 0.080%), Spanish American (45.0%, a difference of 0.19%), Immigrants from Uruguay (45.0%, a difference of 0.19%), and Comanche (45.0%, a difference of 0.20%).
| Demographics | Rating | Rank | Currently Married |
| Immigrants | Azores | 2.5 /100 | #222 | Tragic 45.1% |
| Immigrants | Laos | 2.3 /100 | #223 | Tragic 45.0% |
| Immigrants | Uganda | 2.2 /100 | #224 | Tragic 45.0% |
| French American Indians | 2.2 /100 | #225 | Tragic 45.0% |
| Comanche | 2.1 /100 | #226 | Tragic 45.0% |
| Spanish Americans | 2.1 /100 | #227 | Tragic 45.0% |
| Immigrants | Uruguay | 2.0 /100 | #228 | Tragic 45.0% |
| Cree | 1.7 /100 | #229 | Tragic 44.9% |
| Immigrants | Kenya | 1.6 /100 | #230 | Tragic 44.9% |
| Immigrants | Panama | 1.5 /100 | #231 | Tragic 44.9% |
| Nepalese | 1.2 /100 | #232 | Tragic 44.7% |
| Immigrants | Saudi Arabia | 1.1 /100 | #233 | Tragic 44.7% |
| Iroquois | 1.1 /100 | #234 | Tragic 44.7% |
| Alaskan Athabascans | 0.9 /100 | #235 | Tragic 44.6% |
| Cubans | 0.9 /100 | #236 | Tragic 44.6% |