Immigrants from Liberia vs Nigerian Family Households
COMPARE
Immigrants from Liberia
Nigerian
Family Households
Family Households Comparison
Immigrants from Liberia
Nigerians
62.0%
FAMILY HOUSEHOLDS
0.0/ 100
METRIC RATING
310th/ 347
METRIC RANK
63.9%
FAMILY HOUSEHOLDS
11.5/ 100
METRIC RATING
207th/ 347
METRIC RANK
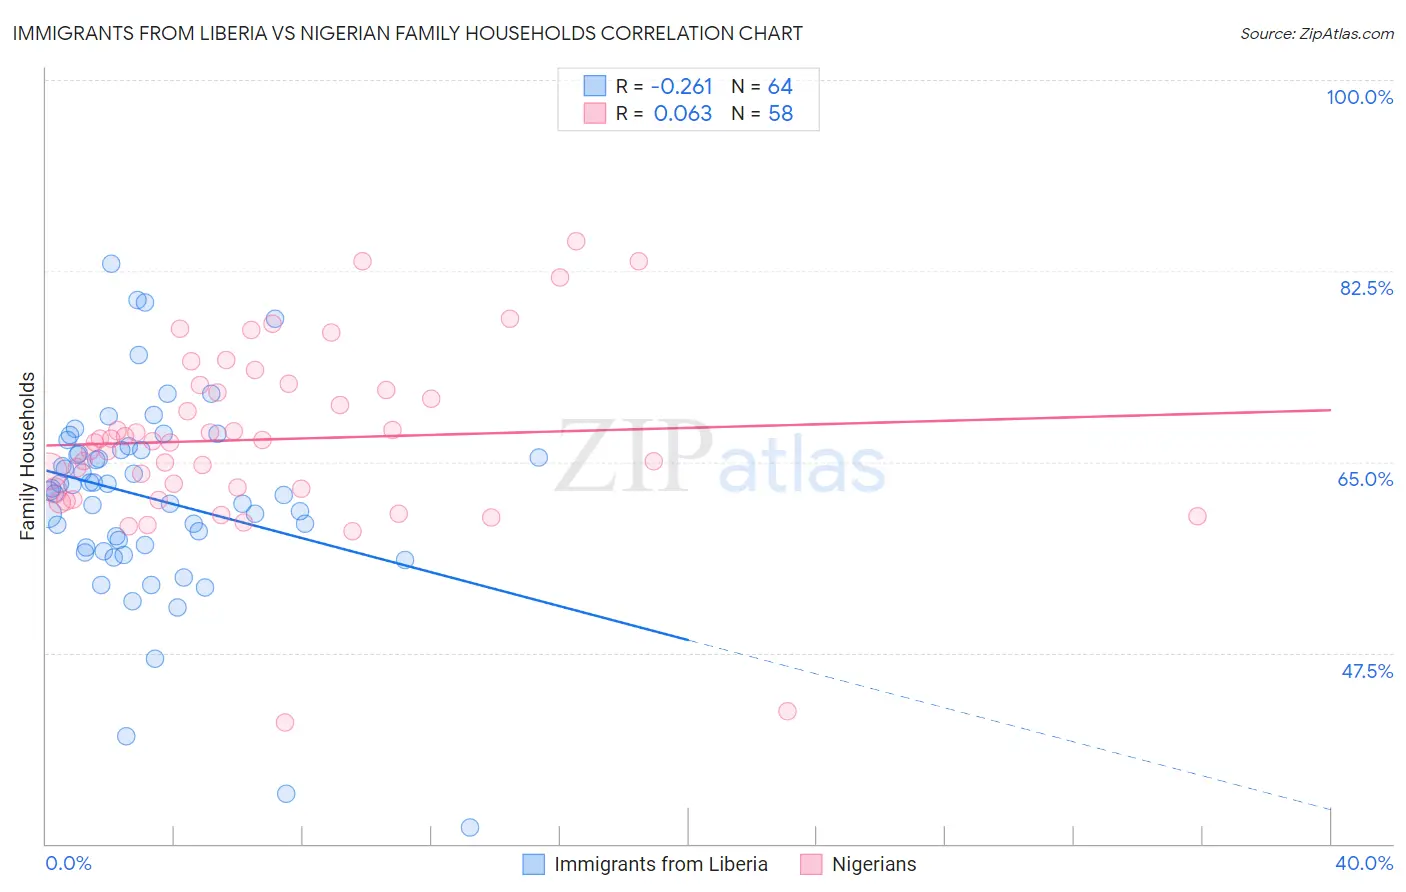
Immigrants from Liberia vs Nigerian Family Households Correlation Chart
The statistical analysis conducted on geographies consisting of 135,243,454 people shows a weak negative correlation between the proportion of Immigrants from Liberia and percentage of family households in the United States with a correlation coefficient (R) of -0.261 and weighted average of 62.0%. Similarly, the statistical analysis conducted on geographies consisting of 332,466,874 people shows a slight positive correlation between the proportion of Nigerians and percentage of family households in the United States with a correlation coefficient (R) of 0.063 and weighted average of 63.9%, a difference of 2.9%.
Family Households Correlation Summary
| Measurement | Immigrants from Liberia | Nigerian |
| Minimum | 31.5% | 41.2% |
| Maximum | 83.2% | 85.2% |
| Range | 51.7% | 44.1% |
| Mean | 61.7% | 67.1% |
| Median | 62.4% | 66.9% |
| Interquartile 25% (IQ1) | 57.3% | 62.4% |
| Interquartile 75% (IQ3) | 66.1% | 71.6% |
| Interquartile Range (IQR) | 8.8% | 9.2% |
| Standard Deviation (Sample) | 9.1% | 8.2% |
| Standard Deviation (Population) | 9.0% | 8.2% |
Similar Demographics by Family Households
Demographics Similar to Immigrants from Liberia by Family Households
In terms of family households, the demographic groups most similar to Immigrants from Liberia are Immigrants from Morocco (62.0%, a difference of 0.030%), Subsaharan African (62.1%, a difference of 0.040%), Immigrants from Latvia (62.0%, a difference of 0.080%), Liberian (62.0%, a difference of 0.080%), and Immigrants from Norway (62.1%, a difference of 0.10%).
| Demographics | Rating | Rank | Family Households |
| Cree | 0.0 /100 | #303 | Tragic 62.3% |
| Iroquois | 0.0 /100 | #304 | Tragic 62.2% |
| Bermudans | 0.0 /100 | #305 | Tragic 62.2% |
| Africans | 0.0 /100 | #306 | Tragic 62.1% |
| Immigrants | Norway | 0.0 /100 | #307 | Tragic 62.1% |
| Chippewa | 0.0 /100 | #308 | Tragic 62.1% |
| Sub-Saharan Africans | 0.0 /100 | #309 | Tragic 62.1% |
| Immigrants | Liberia | 0.0 /100 | #310 | Tragic 62.0% |
| Immigrants | Morocco | 0.0 /100 | #311 | Tragic 62.0% |
| Immigrants | Latvia | 0.0 /100 | #312 | Tragic 62.0% |
| Liberians | 0.0 /100 | #313 | Tragic 62.0% |
| Immigrants | Cabo Verde | 0.0 /100 | #314 | Tragic 61.9% |
| Moroccans | 0.0 /100 | #315 | Tragic 61.9% |
| Immigrants | Middle Africa | 0.0 /100 | #316 | Tragic 61.9% |
| Immigrants | Bosnia and Herzegovina | 0.0 /100 | #317 | Tragic 61.9% |
Demographics Similar to Nigerians by Family Households
In terms of family households, the demographic groups most similar to Nigerians are Immigrants from Bangladesh (63.9%, a difference of 0.0%), Sierra Leonean (63.9%, a difference of 0.010%), Immigrants from Lithuania (63.9%, a difference of 0.020%), Brazilian (63.9%, a difference of 0.030%), and Immigrants from Uruguay (63.9%, a difference of 0.040%).
| Demographics | Rating | Rank | Family Households |
| Immigrants | Malaysia | 17.9 /100 | #200 | Poor 64.0% |
| Immigrants | Eastern Europe | 17.2 /100 | #201 | Poor 64.0% |
| Iranians | 13.5 /100 | #202 | Poor 63.9% |
| Norwegians | 13.2 /100 | #203 | Poor 63.9% |
| Immigrants | Uruguay | 12.8 /100 | #204 | Poor 63.9% |
| Brazilians | 12.4 /100 | #205 | Poor 63.9% |
| Immigrants | Lithuania | 12.1 /100 | #206 | Poor 63.9% |
| Nigerians | 11.5 /100 | #207 | Poor 63.9% |
| Immigrants | Bangladesh | 11.4 /100 | #208 | Poor 63.9% |
| Sierra Leoneans | 11.2 /100 | #209 | Poor 63.9% |
| Immigrants | Thailand | 9.6 /100 | #210 | Tragic 63.8% |
| Shoshone | 9.4 /100 | #211 | Tragic 63.8% |
| Immigrants | Netherlands | 9.4 /100 | #212 | Tragic 63.8% |
| Immigrants | Northern Europe | 8.8 /100 | #213 | Tragic 63.8% |
| Celtics | 8.0 /100 | #214 | Tragic 63.8% |