Pakistani vs Nigerian Family Households
COMPARE
Pakistani
Nigerian
Family Households
Family Households Comparison
Pakistanis
Nigerians
64.7%
FAMILY HOUSEHOLDS
84.0/ 100
METRIC RATING
142nd/ 347
METRIC RANK
63.9%
FAMILY HOUSEHOLDS
11.5/ 100
METRIC RATING
207th/ 347
METRIC RANK
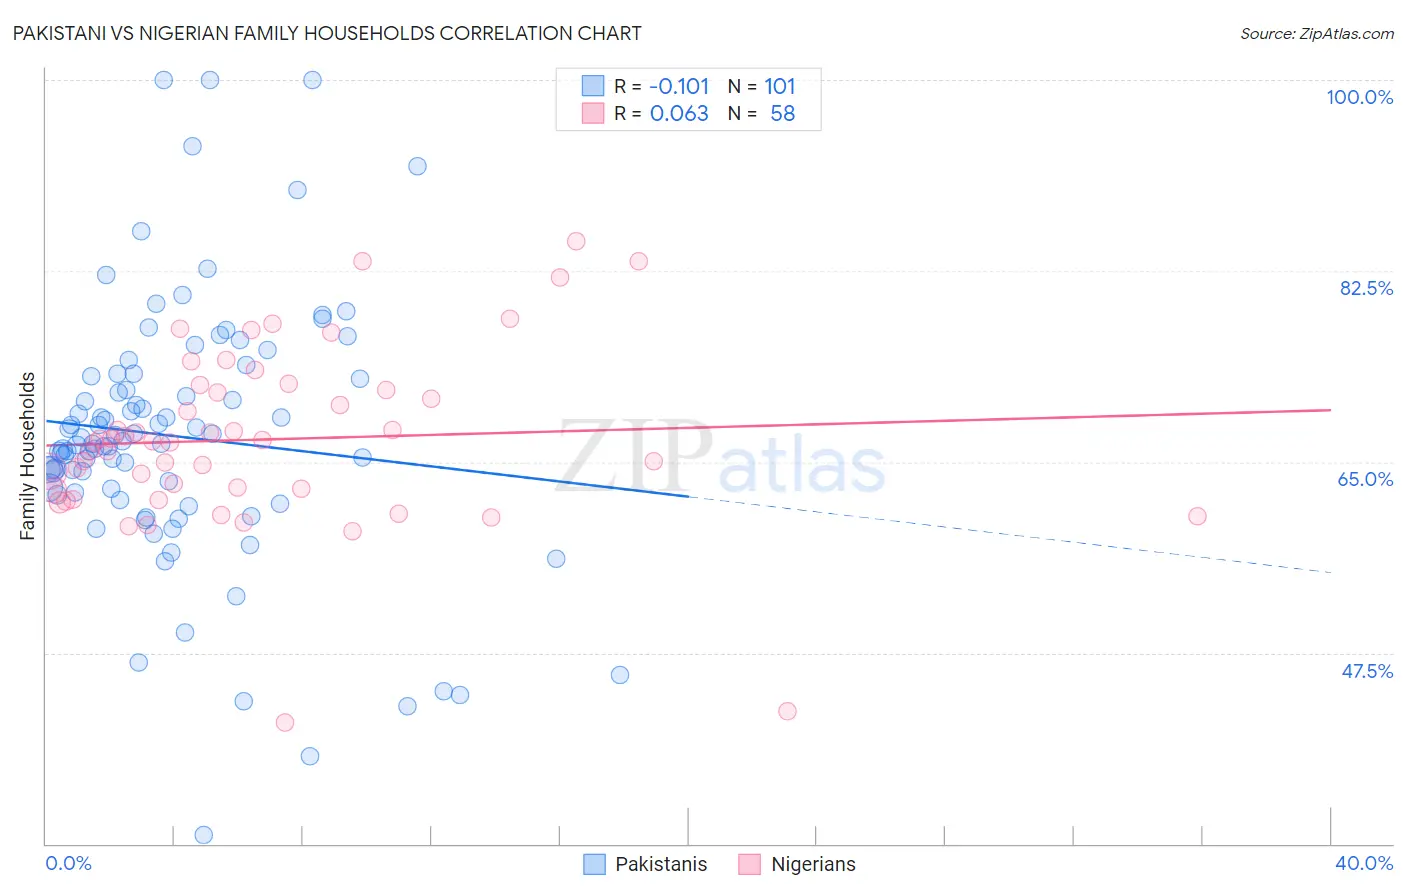
Pakistani vs Nigerian Family Households Correlation Chart
The statistical analysis conducted on geographies consisting of 335,180,363 people shows a poor negative correlation between the proportion of Pakistanis and percentage of family households in the United States with a correlation coefficient (R) of -0.101 and weighted average of 64.7%. Similarly, the statistical analysis conducted on geographies consisting of 332,466,874 people shows a slight positive correlation between the proportion of Nigerians and percentage of family households in the United States with a correlation coefficient (R) of 0.063 and weighted average of 63.9%, a difference of 1.3%.
Family Households Correlation Summary
| Measurement | Pakistani | Nigerian |
| Minimum | 30.8% | 41.2% |
| Maximum | 100.0% | 85.2% |
| Range | 69.2% | 44.1% |
| Mean | 67.3% | 67.1% |
| Median | 66.7% | 66.9% |
| Interquartile 25% (IQ1) | 62.1% | 62.4% |
| Interquartile 75% (IQ3) | 73.0% | 71.6% |
| Interquartile Range (IQR) | 10.9% | 9.2% |
| Standard Deviation (Sample) | 12.1% | 8.2% |
| Standard Deviation (Population) | 12.0% | 8.2% |
Similar Demographics by Family Households
Demographics Similar to Pakistanis by Family Households
In terms of family households, the demographic groups most similar to Pakistanis are Immigrants from North Macedonia (64.7%, a difference of 0.020%), Immigrants from Cameroon (64.7%, a difference of 0.020%), Immigrants from Jamaica (64.7%, a difference of 0.030%), Basque (64.7%, a difference of 0.040%), and Czechoslovakian (64.6%, a difference of 0.050%).
| Demographics | Rating | Rank | Family Households |
| Maltese | 87.4 /100 | #135 | Excellent 64.7% |
| Immigrants | China | 86.6 /100 | #136 | Excellent 64.7% |
| Immigrants | Scotland | 86.4 /100 | #137 | Excellent 64.7% |
| Basques | 85.5 /100 | #138 | Excellent 64.7% |
| Immigrants | Jamaica | 85.3 /100 | #139 | Excellent 64.7% |
| Immigrants | North Macedonia | 84.9 /100 | #140 | Excellent 64.7% |
| Immigrants | Cameroon | 84.8 /100 | #141 | Excellent 64.7% |
| Pakistanis | 84.0 /100 | #142 | Excellent 64.7% |
| Czechoslovakians | 82.1 /100 | #143 | Excellent 64.6% |
| South American Indians | 81.9 /100 | #144 | Excellent 64.6% |
| Welsh | 80.1 /100 | #145 | Excellent 64.6% |
| Immigrants | Romania | 77.0 /100 | #146 | Good 64.6% |
| Immigrants | Chile | 76.5 /100 | #147 | Good 64.6% |
| Delaware | 76.3 /100 | #148 | Good 64.6% |
| Sioux | 76.3 /100 | #149 | Good 64.6% |
Demographics Similar to Nigerians by Family Households
In terms of family households, the demographic groups most similar to Nigerians are Immigrants from Bangladesh (63.9%, a difference of 0.0%), Sierra Leonean (63.9%, a difference of 0.010%), Immigrants from Lithuania (63.9%, a difference of 0.020%), Brazilian (63.9%, a difference of 0.030%), and Immigrants from Uruguay (63.9%, a difference of 0.040%).
| Demographics | Rating | Rank | Family Households |
| Immigrants | Malaysia | 17.9 /100 | #200 | Poor 64.0% |
| Immigrants | Eastern Europe | 17.2 /100 | #201 | Poor 64.0% |
| Iranians | 13.5 /100 | #202 | Poor 63.9% |
| Norwegians | 13.2 /100 | #203 | Poor 63.9% |
| Immigrants | Uruguay | 12.8 /100 | #204 | Poor 63.9% |
| Brazilians | 12.4 /100 | #205 | Poor 63.9% |
| Immigrants | Lithuania | 12.1 /100 | #206 | Poor 63.9% |
| Nigerians | 11.5 /100 | #207 | Poor 63.9% |
| Immigrants | Bangladesh | 11.4 /100 | #208 | Poor 63.9% |
| Sierra Leoneans | 11.2 /100 | #209 | Poor 63.9% |
| Immigrants | Thailand | 9.6 /100 | #210 | Tragic 63.8% |
| Shoshone | 9.4 /100 | #211 | Tragic 63.8% |
| Immigrants | Netherlands | 9.4 /100 | #212 | Tragic 63.8% |
| Immigrants | Northern Europe | 8.8 /100 | #213 | Tragic 63.8% |
| Celtics | 8.0 /100 | #214 | Tragic 63.8% |