Mongolian vs Immigrants from Europe Family Households
COMPARE
Mongolian
Immigrants from Europe
Family Households
Family Households Comparison
Mongolians
Immigrants from Europe
62.8%
FAMILY HOUSEHOLDS
0.1/ 100
METRIC RATING
285th/ 347
METRIC RANK
63.7%
FAMILY HOUSEHOLDS
6.4/ 100
METRIC RATING
220th/ 347
METRIC RANK
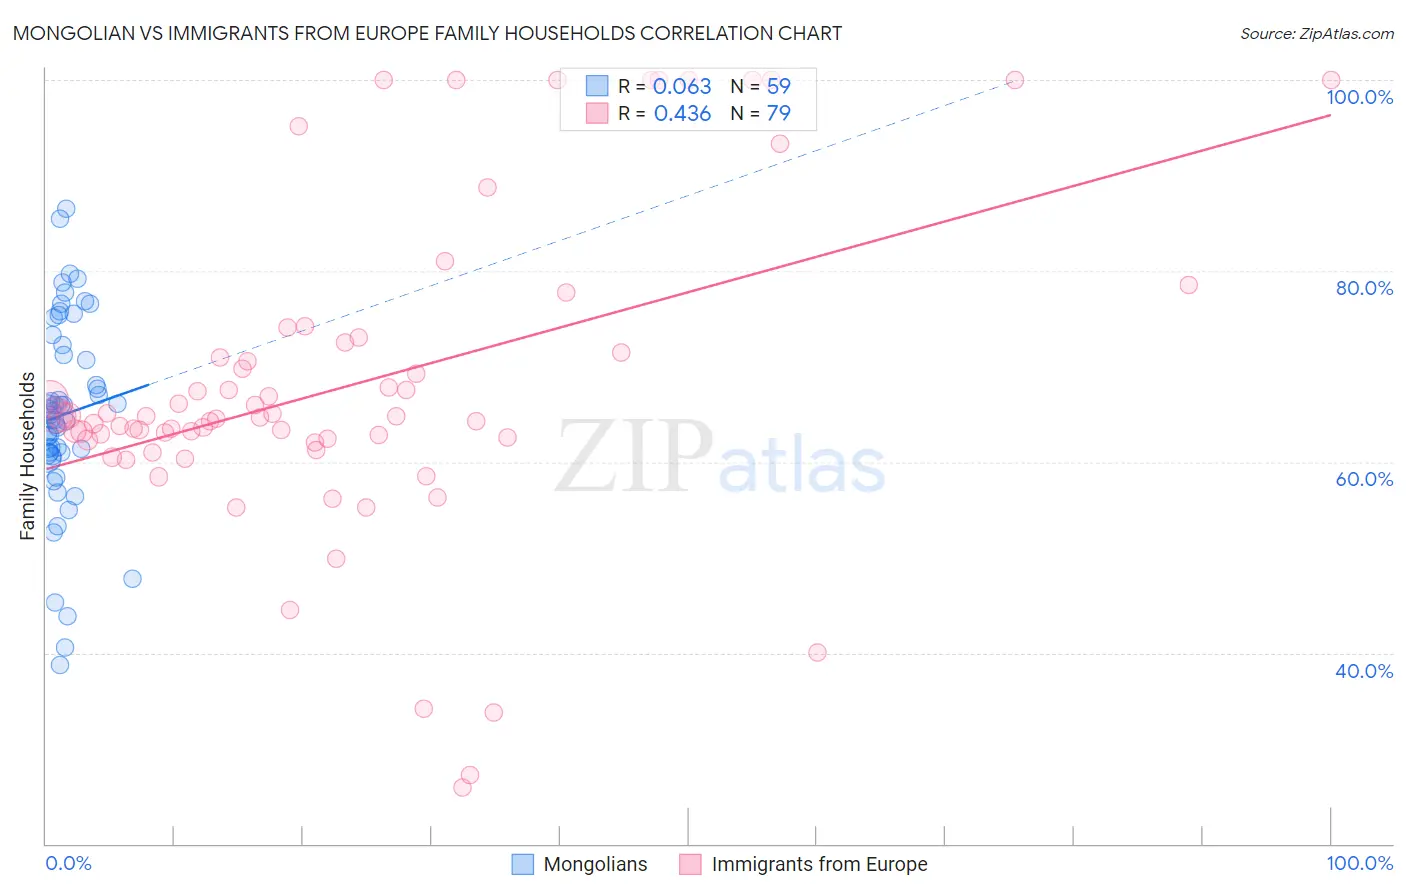
Mongolian vs Immigrants from Europe Family Households Correlation Chart
The statistical analysis conducted on geographies consisting of 140,293,840 people shows a slight positive correlation between the proportion of Mongolians and percentage of family households in the United States with a correlation coefficient (R) of 0.063 and weighted average of 62.8%. Similarly, the statistical analysis conducted on geographies consisting of 546,902,993 people shows a moderate positive correlation between the proportion of Immigrants from Europe and percentage of family households in the United States with a correlation coefficient (R) of 0.436 and weighted average of 63.7%, a difference of 1.5%.
Family Households Correlation Summary
| Measurement | Mongolian | Immigrants from Europe |
| Minimum | 38.8% | 25.9% |
| Maximum | 86.5% | 100.0% |
| Range | 47.8% | 74.1% |
| Mean | 65.0% | 68.1% |
| Median | 64.9% | 64.7% |
| Interquartile 25% (IQ1) | 60.9% | 62.2% |
| Interquartile 75% (IQ3) | 72.2% | 72.5% |
| Interquartile Range (IQR) | 11.3% | 10.2% |
| Standard Deviation (Sample) | 10.1% | 16.6% |
| Standard Deviation (Population) | 10.0% | 16.5% |
Similar Demographics by Family Households
Demographics Similar to Mongolians by Family Households
In terms of family households, the demographic groups most similar to Mongolians are British West Indian (62.8%, a difference of 0.030%), Latvian (62.8%, a difference of 0.030%), Immigrants from Uganda (62.7%, a difference of 0.050%), Australian (62.8%, a difference of 0.10%), and Immigrants from Nepal (62.7%, a difference of 0.14%).
| Demographics | Rating | Rank | Family Households |
| Immigrants | Belgium | 0.2 /100 | #278 | Tragic 63.0% |
| Immigrants | Yemen | 0.2 /100 | #279 | Tragic 63.0% |
| Immigrants | Bulgaria | 0.2 /100 | #280 | Tragic 63.0% |
| Estonians | 0.2 /100 | #281 | Tragic 62.9% |
| New Zealanders | 0.1 /100 | #282 | Tragic 62.9% |
| Immigrants | Denmark | 0.1 /100 | #283 | Tragic 62.9% |
| Australians | 0.1 /100 | #284 | Tragic 62.8% |
| Mongolians | 0.1 /100 | #285 | Tragic 62.8% |
| British West Indians | 0.1 /100 | #286 | Tragic 62.8% |
| Latvians | 0.1 /100 | #287 | Tragic 62.8% |
| Immigrants | Uganda | 0.1 /100 | #288 | Tragic 62.7% |
| Immigrants | Nepal | 0.1 /100 | #289 | Tragic 62.7% |
| Immigrants | Grenada | 0.0 /100 | #290 | Tragic 62.6% |
| U.S. Virgin Islanders | 0.0 /100 | #291 | Tragic 62.6% |
| Immigrants | Burma/Myanmar | 0.0 /100 | #292 | Tragic 62.6% |
Demographics Similar to Immigrants from Europe by Family Households
In terms of family households, the demographic groups most similar to Immigrants from Europe are Macedonian (63.7%, a difference of 0.010%), Immigrants from South Africa (63.7%, a difference of 0.020%), Osage (63.7%, a difference of 0.030%), Marshallese (63.7%, a difference of 0.030%), and Croatian (63.8%, a difference of 0.050%).
| Demographics | Rating | Rank | Family Households |
| Immigrants | Northern Europe | 8.8 /100 | #213 | Tragic 63.8% |
| Celtics | 8.0 /100 | #214 | Tragic 63.8% |
| Belgians | 7.6 /100 | #215 | Tragic 63.8% |
| Croatians | 7.3 /100 | #216 | Tragic 63.8% |
| Osage | 7.0 /100 | #217 | Tragic 63.7% |
| Marshallese | 6.9 /100 | #218 | Tragic 63.7% |
| Macedonians | 6.5 /100 | #219 | Tragic 63.7% |
| Immigrants | Europe | 6.4 /100 | #220 | Tragic 63.7% |
| Immigrants | South Africa | 5.9 /100 | #221 | Tragic 63.7% |
| Immigrants | Belarus | 5.5 /100 | #222 | Tragic 63.7% |
| French Canadians | 5.4 /100 | #223 | Tragic 63.7% |
| Turks | 4.5 /100 | #224 | Tragic 63.6% |
| Immigrants | Hungary | 4.3 /100 | #225 | Tragic 63.6% |
| Immigrants | Bahamas | 4.2 /100 | #226 | Tragic 63.6% |
| Trinidadians and Tobagonians | 4.1 /100 | #227 | Tragic 63.6% |