Hungarian vs Northern European Female Unemployment
COMPARE
Hungarian
Northern European
Female Unemployment
Female Unemployment Comparison
Hungarians
Northern Europeans
4.9%
FEMALE UNEMPLOYMENT
98.3/ 100
METRIC RATING
66th/ 347
METRIC RANK
4.8%
FEMALE UNEMPLOYMENT
99.6/ 100
METRIC RATING
38th/ 347
METRIC RANK
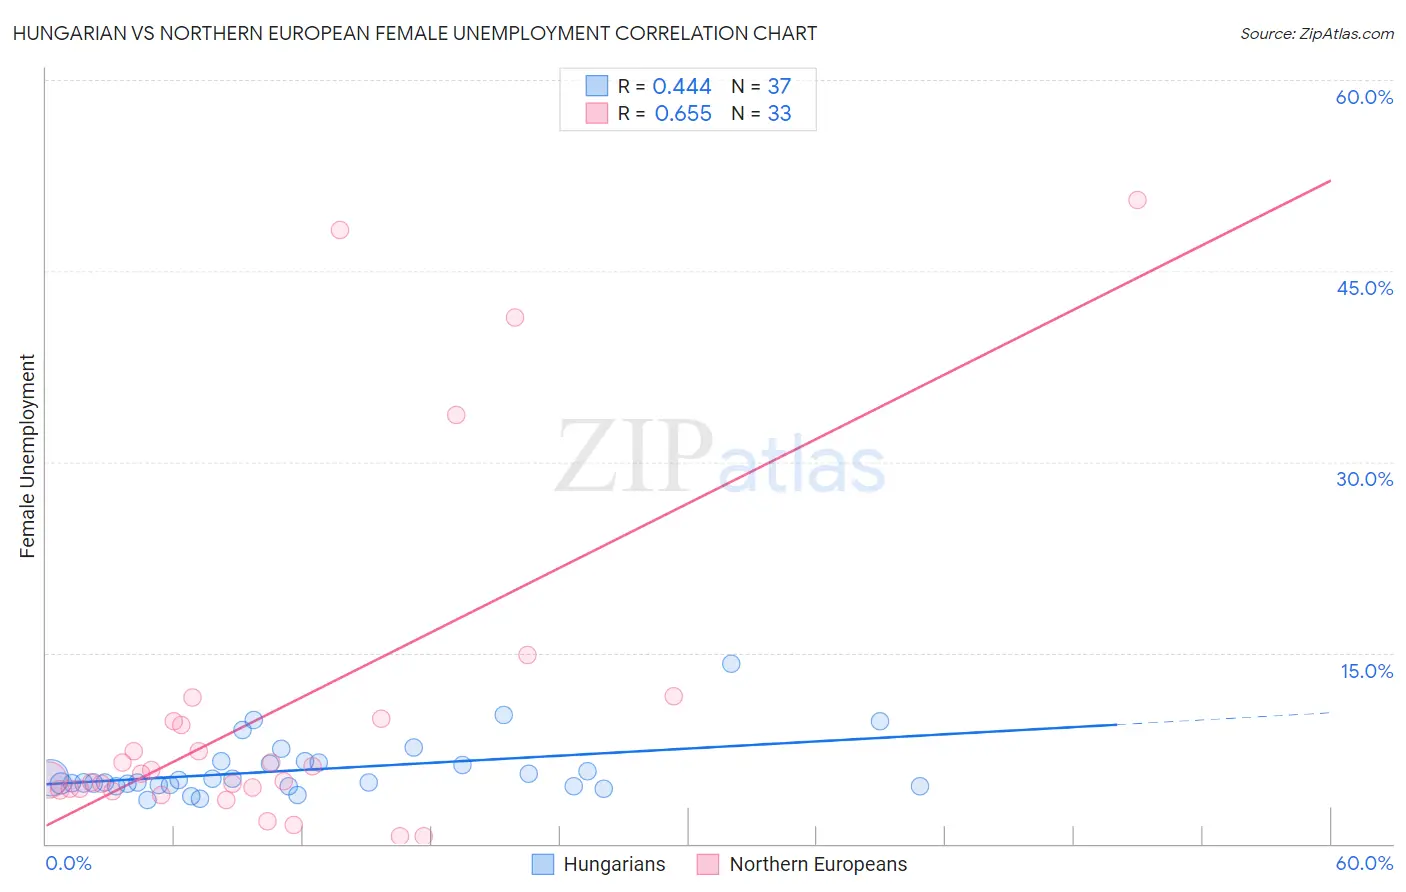
Hungarian vs Northern European Female Unemployment Correlation Chart
The statistical analysis conducted on geographies consisting of 480,650,444 people shows a moderate positive correlation between the proportion of Hungarians and unemploymnet rate among females in the United States with a correlation coefficient (R) of 0.444 and weighted average of 4.9%. Similarly, the statistical analysis conducted on geographies consisting of 402,850,134 people shows a significant positive correlation between the proportion of Northern Europeans and unemploymnet rate among females in the United States with a correlation coefficient (R) of 0.655 and weighted average of 4.8%, a difference of 2.4%.
Female Unemployment Correlation Summary
| Measurement | Hungarian | Northern European |
| Minimum | 3.5% | 0.60% |
| Maximum | 14.1% | 50.6% |
| Range | 10.6% | 50.0% |
| Mean | 5.8% | 10.4% |
| Median | 4.8% | 5.5% |
| Interquartile 25% (IQ1) | 4.6% | 4.3% |
| Interquartile 75% (IQ3) | 6.4% | 9.7% |
| Interquartile Range (IQR) | 1.9% | 5.4% |
| Standard Deviation (Sample) | 2.2% | 13.1% |
| Standard Deviation (Population) | 2.2% | 12.9% |
Similar Demographics by Female Unemployment
Demographics Similar to Hungarians by Female Unemployment
In terms of female unemployment, the demographic groups most similar to Hungarians are Cuban (4.9%, a difference of 0.0%), Tlingit-Haida (4.9%, a difference of 0.010%), Immigrants from Ireland (4.9%, a difference of 0.020%), Immigrants from North America (4.9%, a difference of 0.030%), and Osage (4.9%, a difference of 0.060%).
| Demographics | Rating | Rank | Female Unemployment |
| Bhutanese | 98.7 /100 | #59 | Exceptional 4.9% |
| Immigrants | Scotland | 98.6 /100 | #60 | Exceptional 4.9% |
| Immigrants | Canada | 98.6 /100 | #61 | Exceptional 4.9% |
| Immigrants | Nepal | 98.6 /100 | #62 | Exceptional 4.9% |
| Immigrants | Belgium | 98.5 /100 | #63 | Exceptional 4.9% |
| Celtics | 98.5 /100 | #64 | Exceptional 4.9% |
| Immigrants | North America | 98.3 /100 | #65 | Exceptional 4.9% |
| Hungarians | 98.3 /100 | #66 | Exceptional 4.9% |
| Cubans | 98.3 /100 | #67 | Exceptional 4.9% |
| Tlingit-Haida | 98.3 /100 | #68 | Exceptional 4.9% |
| Immigrants | Ireland | 98.2 /100 | #69 | Exceptional 4.9% |
| Osage | 98.2 /100 | #70 | Exceptional 4.9% |
| German Russians | 98.1 /100 | #71 | Exceptional 4.9% |
| Immigrants | Northern Europe | 98.0 /100 | #72 | Exceptional 4.9% |
| Russians | 98.0 /100 | #73 | Exceptional 5.0% |
Demographics Similar to Northern Europeans by Female Unemployment
In terms of female unemployment, the demographic groups most similar to Northern Europeans are Scotch-Irish (4.8%, a difference of 0.010%), French (4.8%, a difference of 0.050%), Pennsylvania German (4.8%, a difference of 0.11%), Tongan (4.8%, a difference of 0.31%), and Italian (4.8%, a difference of 0.44%).
| Demographics | Rating | Rank | Female Unemployment |
| Sudanese | 99.8 /100 | #31 | Exceptional 4.8% |
| Slovaks | 99.8 /100 | #32 | Exceptional 4.8% |
| Czechoslovakians | 99.7 /100 | #33 | Exceptional 4.8% |
| Zimbabweans | 99.7 /100 | #34 | Exceptional 4.8% |
| French Canadians | 99.7 /100 | #35 | Exceptional 4.8% |
| Yugoslavians | 99.7 /100 | #36 | Exceptional 4.8% |
| Pennsylvania Germans | 99.6 /100 | #37 | Exceptional 4.8% |
| Northern Europeans | 99.6 /100 | #38 | Exceptional 4.8% |
| Scotch-Irish | 99.6 /100 | #39 | Exceptional 4.8% |
| French | 99.6 /100 | #40 | Exceptional 4.8% |
| Tongans | 99.5 /100 | #41 | Exceptional 4.8% |
| Italians | 99.5 /100 | #42 | Exceptional 4.8% |
| Eastern Europeans | 99.4 /100 | #43 | Exceptional 4.9% |
| Greeks | 99.4 /100 | #44 | Exceptional 4.9% |
| Austrians | 99.3 /100 | #45 | Exceptional 4.9% |