Ghanaian vs Immigrants from Malaysia Divorced or Separated
COMPARE
Ghanaian
Immigrants from Malaysia
Divorced or Separated
Divorced or Separated Comparison
Ghanaians
Immigrants from Malaysia
12.1%
DIVORCED OR SEPARATED
45.9/ 100
METRIC RATING
178th/ 347
METRIC RANK
11.0%
DIVORCED OR SEPARATED
100.0/ 100
METRIC RATING
28th/ 347
METRIC RANK
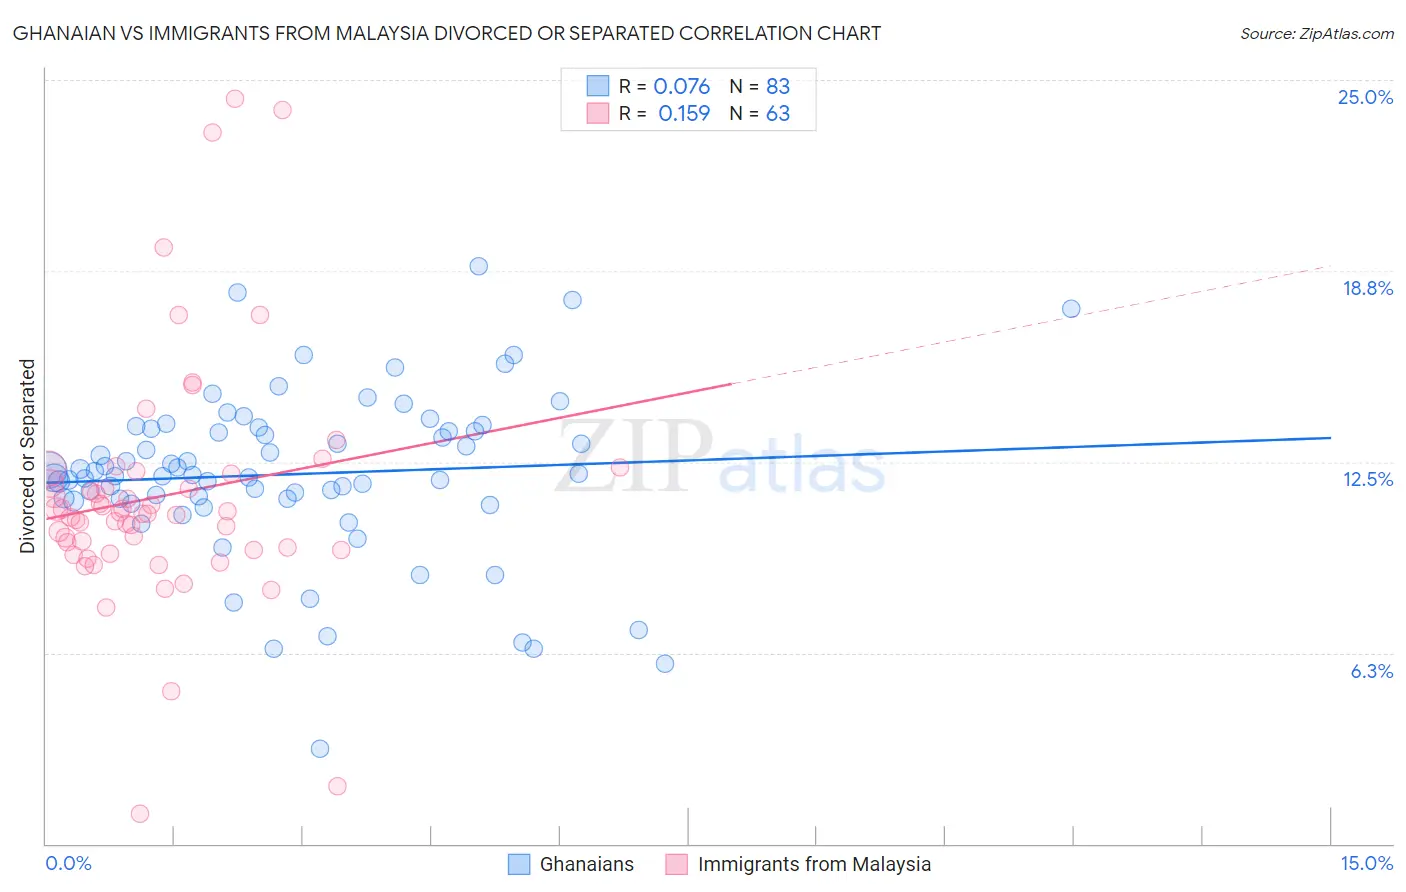
Ghanaian vs Immigrants from Malaysia Divorced or Separated Correlation Chart
The statistical analysis conducted on geographies consisting of 190,579,884 people shows a slight positive correlation between the proportion of Ghanaians and percentage of population currently divorced or separated in the United States with a correlation coefficient (R) of 0.076 and weighted average of 12.1%. Similarly, the statistical analysis conducted on geographies consisting of 197,936,479 people shows a poor positive correlation between the proportion of Immigrants from Malaysia and percentage of population currently divorced or separated in the United States with a correlation coefficient (R) of 0.159 and weighted average of 11.0%, a difference of 10.1%.
Divorced or Separated Correlation Summary
| Measurement | Ghanaian | Immigrants from Malaysia |
| Minimum | 3.1% | 1.0% |
| Maximum | 18.9% | 24.4% |
| Range | 15.8% | 23.4% |
| Mean | 12.1% | 11.4% |
| Median | 12.1% | 10.8% |
| Interquartile 25% (IQ1) | 11.3% | 9.6% |
| Interquartile 75% (IQ3) | 13.6% | 12.1% |
| Interquartile Range (IQR) | 2.3% | 2.5% |
| Standard Deviation (Sample) | 2.7% | 4.0% |
| Standard Deviation (Population) | 2.7% | 4.0% |
Similar Demographics by Divorced or Separated
Demographics Similar to Ghanaians by Divorced or Separated
In terms of divorced or separated, the demographic groups most similar to Ghanaians are Immigrants from Western Europe (12.1%, a difference of 0.010%), Barbadian (12.1%, a difference of 0.030%), Brazilian (12.1%, a difference of 0.060%), Immigrants from Canada (12.1%, a difference of 0.060%), and Immigrants from Ethiopia (12.1%, a difference of 0.10%).
| Demographics | Rating | Rank | Divorced or Separated |
| Costa Ricans | 53.3 /100 | #171 | Average 12.0% |
| Immigrants | Mexico | 53.2 /100 | #172 | Average 12.0% |
| Immigrants | Moldova | 50.4 /100 | #173 | Average 12.1% |
| Hawaiians | 50.0 /100 | #174 | Average 12.1% |
| Immigrants | Sierra Leone | 50.0 /100 | #175 | Average 12.1% |
| Pennsylvania Germans | 48.9 /100 | #176 | Average 12.1% |
| Brazilians | 47.7 /100 | #177 | Average 12.1% |
| Ghanaians | 45.9 /100 | #178 | Average 12.1% |
| Immigrants | Western Europe | 45.6 /100 | #179 | Average 12.1% |
| Barbadians | 45.0 /100 | #180 | Average 12.1% |
| Immigrants | Canada | 44.0 /100 | #181 | Average 12.1% |
| Immigrants | Ethiopia | 43.1 /100 | #182 | Average 12.1% |
| Immigrants | Central America | 42.9 /100 | #183 | Average 12.1% |
| Immigrants | North America | 41.1 /100 | #184 | Average 12.1% |
| Immigrants | Nigeria | 40.5 /100 | #185 | Average 12.1% |
Demographics Similar to Immigrants from Malaysia by Divorced or Separated
In terms of divorced or separated, the demographic groups most similar to Immigrants from Malaysia are Immigrants from Bangladesh (11.0%, a difference of 0.030%), Armenian (11.0%, a difference of 0.070%), Immigrants from Indonesia (10.9%, a difference of 0.47%), Immigrants from Ireland (11.0%, a difference of 0.59%), and Mongolian (11.1%, a difference of 0.89%).
| Demographics | Rating | Rank | Divorced or Separated |
| Immigrants | Asia | 100.0 /100 | #21 | Exceptional 10.7% |
| Vietnamese | 100.0 /100 | #22 | Exceptional 10.8% |
| Immigrants | Pakistan | 100.0 /100 | #23 | Exceptional 10.8% |
| Immigrants | Sri Lanka | 100.0 /100 | #24 | Exceptional 10.8% |
| Iranians | 100.0 /100 | #25 | Exceptional 10.8% |
| Immigrants | Indonesia | 100.0 /100 | #26 | Exceptional 10.9% |
| Immigrants | Bangladesh | 100.0 /100 | #27 | Exceptional 11.0% |
| Immigrants | Malaysia | 100.0 /100 | #28 | Exceptional 11.0% |
| Armenians | 100.0 /100 | #29 | Exceptional 11.0% |
| Immigrants | Ireland | 100.0 /100 | #30 | Exceptional 11.0% |
| Mongolians | 100.0 /100 | #31 | Exceptional 11.1% |
| Tongans | 100.0 /100 | #32 | Exceptional 11.1% |
| Egyptians | 100.0 /100 | #33 | Exceptional 11.1% |
| Immigrants | Uzbekistan | 100.0 /100 | #34 | Exceptional 11.1% |
| Cambodians | 100.0 /100 | #35 | Exceptional 11.1% |