Barbadian vs Zimbabwean Family Households
COMPARE
Barbadian
Zimbabwean
Family Households
Family Households Comparison
Barbadians
Zimbabweans
62.5%
FAMILY HOUSEHOLDS
0.0/ 100
METRIC RATING
294th/ 347
METRIC RANK
64.1%
FAMILY HOUSEHOLDS
24.7/ 100
METRIC RATING
190th/ 347
METRIC RANK
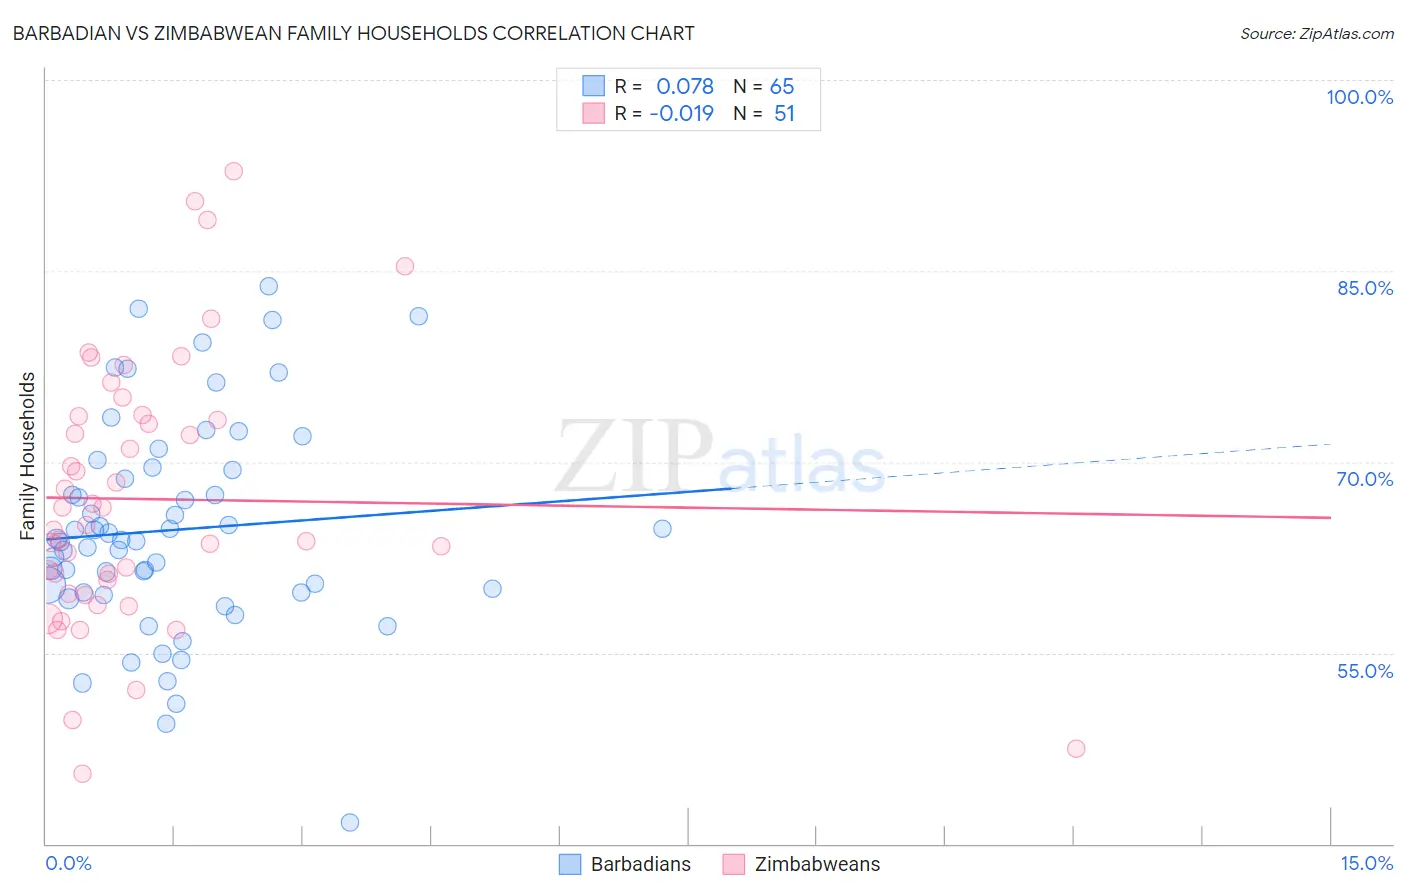
Barbadian vs Zimbabwean Family Households Correlation Chart
The statistical analysis conducted on geographies consisting of 141,274,787 people shows a slight positive correlation between the proportion of Barbadians and percentage of family households in the United States with a correlation coefficient (R) of 0.078 and weighted average of 62.5%. Similarly, the statistical analysis conducted on geographies consisting of 69,192,017 people shows no correlation between the proportion of Zimbabweans and percentage of family households in the United States with a correlation coefficient (R) of -0.019 and weighted average of 64.1%, a difference of 2.6%.
Family Households Correlation Summary
| Measurement | Barbadian | Zimbabwean |
| Minimum | 41.7% | 45.5% |
| Maximum | 83.8% | 92.9% |
| Range | 42.1% | 47.3% |
| Mean | 64.7% | 67.1% |
| Median | 63.8% | 65.0% |
| Interquartile 25% (IQ1) | 59.8% | 59.7% |
| Interquartile 75% (IQ3) | 69.5% | 73.6% |
| Interquartile Range (IQR) | 9.7% | 13.9% |
| Standard Deviation (Sample) | 8.4% | 10.5% |
| Standard Deviation (Population) | 8.3% | 10.4% |
Similar Demographics by Family Households
Demographics Similar to Barbadians by Family Households
In terms of family households, the demographic groups most similar to Barbadians are Okinawan (62.5%, a difference of 0.010%), Slovene (62.4%, a difference of 0.020%), French American Indian (62.4%, a difference of 0.040%), Immigrants from Sweden (62.5%, a difference of 0.060%), and Immigrants from Spain (62.4%, a difference of 0.060%).
| Demographics | Rating | Rank | Family Households |
| Latvians | 0.1 /100 | #287 | Tragic 62.8% |
| Immigrants | Uganda | 0.1 /100 | #288 | Tragic 62.7% |
| Immigrants | Nepal | 0.1 /100 | #289 | Tragic 62.7% |
| Immigrants | Grenada | 0.0 /100 | #290 | Tragic 62.6% |
| U.S. Virgin Islanders | 0.0 /100 | #291 | Tragic 62.6% |
| Immigrants | Burma/Myanmar | 0.0 /100 | #292 | Tragic 62.6% |
| Immigrants | Sweden | 0.0 /100 | #293 | Tragic 62.5% |
| Barbadians | 0.0 /100 | #294 | Tragic 62.5% |
| Okinawans | 0.0 /100 | #295 | Tragic 62.5% |
| Slovenes | 0.0 /100 | #296 | Tragic 62.4% |
| French American Indians | 0.0 /100 | #297 | Tragic 62.4% |
| Immigrants | Spain | 0.0 /100 | #298 | Tragic 62.4% |
| Immigrants | Kuwait | 0.0 /100 | #299 | Tragic 62.4% |
| Immigrants | Africa | 0.0 /100 | #300 | Tragic 62.4% |
| Immigrants | Albania | 0.0 /100 | #301 | Tragic 62.4% |
Demographics Similar to Zimbabweans by Family Households
In terms of family households, the demographic groups most similar to Zimbabweans are Arab (64.1%, a difference of 0.0%), Immigrants from Western Asia (64.1%, a difference of 0.010%), Lithuanian (64.0%, a difference of 0.020%), French (64.0%, a difference of 0.020%), and Paraguayan (64.1%, a difference of 0.040%).
| Demographics | Rating | Rank | Family Households |
| Creek | 34.1 /100 | #183 | Fair 64.2% |
| Puerto Ricans | 33.4 /100 | #184 | Fair 64.2% |
| Immigrants | Iran | 30.4 /100 | #185 | Fair 64.1% |
| Spanish Americans | 30.1 /100 | #186 | Fair 64.1% |
| Northern Europeans | 28.2 /100 | #187 | Fair 64.1% |
| Paraguayans | 26.7 /100 | #188 | Fair 64.1% |
| Immigrants | Western Asia | 25.3 /100 | #189 | Fair 64.1% |
| Zimbabweans | 24.7 /100 | #190 | Fair 64.1% |
| Arabs | 24.5 /100 | #191 | Fair 64.1% |
| Lithuanians | 23.8 /100 | #192 | Fair 64.0% |
| French | 23.7 /100 | #193 | Fair 64.0% |
| Paiute | 22.2 /100 | #194 | Fair 64.0% |
| Immigrants | North America | 20.0 /100 | #195 | Poor 64.0% |
| Immigrants | Canada | 19.2 /100 | #196 | Poor 64.0% |
| Seminole | 18.9 /100 | #197 | Poor 64.0% |