Nicaraguan vs Zimbabwean Family Households
COMPARE
Nicaraguan
Zimbabwean
Family Households
Family Households Comparison
Nicaraguans
Zimbabweans
67.4%
FAMILY HOUSEHOLDS
100.0/ 100
METRIC RATING
29th/ 347
METRIC RANK
64.1%
FAMILY HOUSEHOLDS
24.7/ 100
METRIC RATING
190th/ 347
METRIC RANK
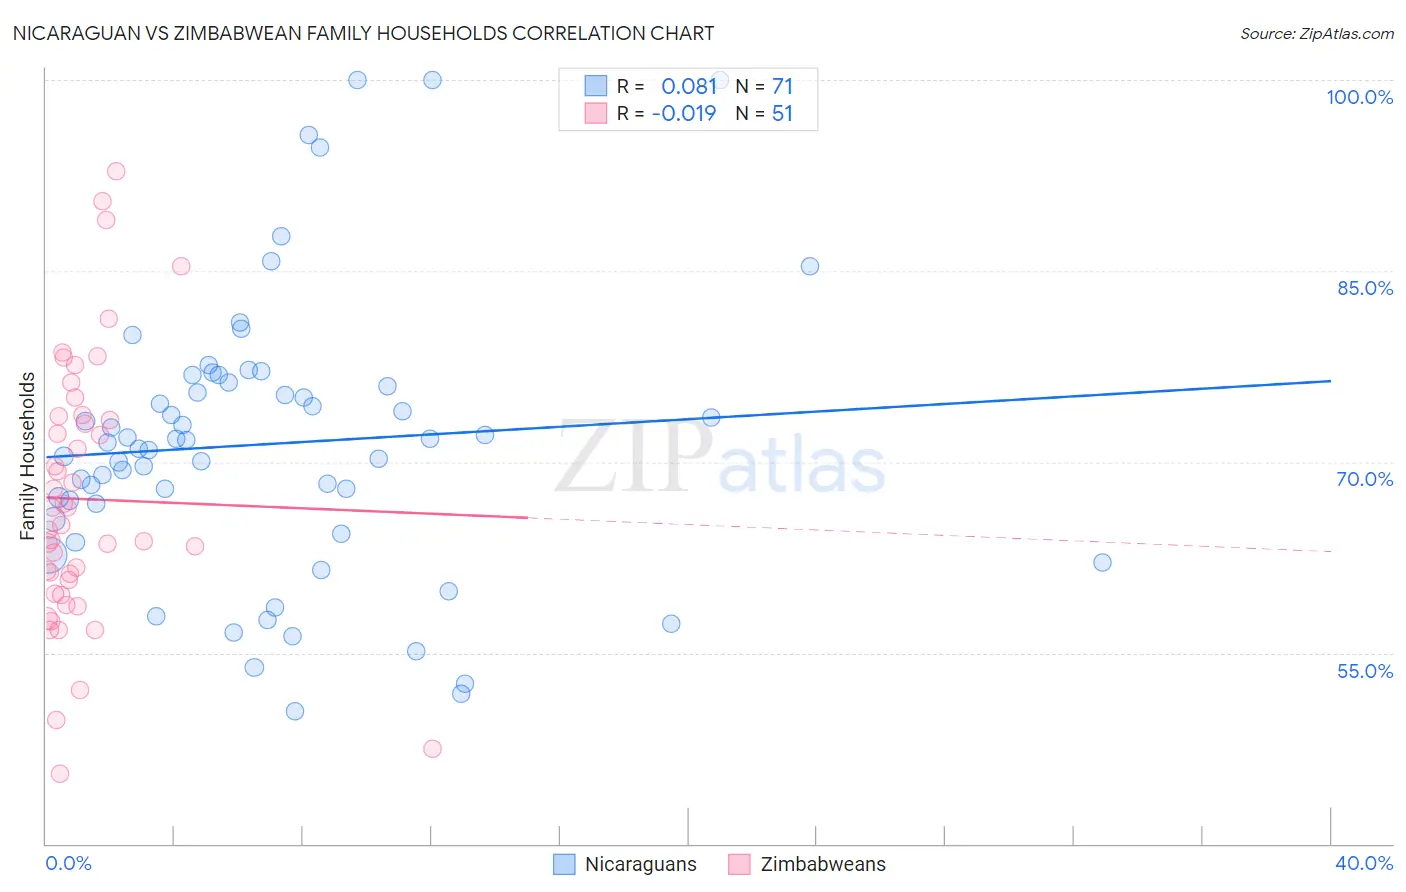
Nicaraguan vs Zimbabwean Family Households Correlation Chart
The statistical analysis conducted on geographies consisting of 285,625,723 people shows a slight positive correlation between the proportion of Nicaraguans and percentage of family households in the United States with a correlation coefficient (R) of 0.081 and weighted average of 67.4%. Similarly, the statistical analysis conducted on geographies consisting of 69,192,017 people shows no correlation between the proportion of Zimbabweans and percentage of family households in the United States with a correlation coefficient (R) of -0.019 and weighted average of 64.1%, a difference of 5.2%.
Family Households Correlation Summary
| Measurement | Nicaraguan | Zimbabwean |
| Minimum | 50.4% | 45.5% |
| Maximum | 100.0% | 92.9% |
| Range | 49.6% | 47.3% |
| Mean | 71.4% | 67.1% |
| Median | 71.5% | 65.0% |
| Interquartile 25% (IQ1) | 65.5% | 59.7% |
| Interquartile 75% (IQ3) | 76.3% | 73.6% |
| Interquartile Range (IQR) | 10.8% | 13.9% |
| Standard Deviation (Sample) | 11.0% | 10.5% |
| Standard Deviation (Population) | 10.9% | 10.4% |
Similar Demographics by Family Households
Demographics Similar to Nicaraguans by Family Households
In terms of family households, the demographic groups most similar to Nicaraguans are Hawaiian (67.4%, a difference of 0.070%), Hispanic or Latino (67.4%, a difference of 0.080%), Immigrants from India (67.4%, a difference of 0.13%), Immigrants from Nicaragua (67.5%, a difference of 0.14%), and Immigrants from South Eastern Asia (67.5%, a difference of 0.16%).
| Demographics | Rating | Rank | Family Households |
| Sri Lankans | 100.0 /100 | #22 | Exceptional 67.7% |
| Immigrants | Pakistan | 100.0 /100 | #23 | Exceptional 67.7% |
| Immigrants | South Eastern Asia | 100.0 /100 | #24 | Exceptional 67.5% |
| Immigrants | Nicaragua | 100.0 /100 | #25 | Exceptional 67.5% |
| Immigrants | India | 100.0 /100 | #26 | Exceptional 67.4% |
| Hispanics or Latinos | 100.0 /100 | #27 | Exceptional 67.4% |
| Hawaiians | 100.0 /100 | #28 | Exceptional 67.4% |
| Nicaraguans | 100.0 /100 | #29 | Exceptional 67.4% |
| Immigrants | Peru | 100.0 /100 | #30 | Exceptional 67.2% |
| Immigrants | Latin America | 100.0 /100 | #31 | Exceptional 67.2% |
| Nepalese | 100.0 /100 | #32 | Exceptional 67.2% |
| Salvadorans | 100.0 /100 | #33 | Exceptional 67.2% |
| Thais | 100.0 /100 | #34 | Exceptional 67.2% |
| Tohono O'odham | 100.0 /100 | #35 | Exceptional 67.1% |
| Peruvians | 100.0 /100 | #36 | Exceptional 67.1% |
Demographics Similar to Zimbabweans by Family Households
In terms of family households, the demographic groups most similar to Zimbabweans are Arab (64.1%, a difference of 0.0%), Immigrants from Western Asia (64.1%, a difference of 0.010%), Lithuanian (64.0%, a difference of 0.020%), French (64.0%, a difference of 0.020%), and Paraguayan (64.1%, a difference of 0.040%).
| Demographics | Rating | Rank | Family Households |
| Creek | 34.1 /100 | #183 | Fair 64.2% |
| Puerto Ricans | 33.4 /100 | #184 | Fair 64.2% |
| Immigrants | Iran | 30.4 /100 | #185 | Fair 64.1% |
| Spanish Americans | 30.1 /100 | #186 | Fair 64.1% |
| Northern Europeans | 28.2 /100 | #187 | Fair 64.1% |
| Paraguayans | 26.7 /100 | #188 | Fair 64.1% |
| Immigrants | Western Asia | 25.3 /100 | #189 | Fair 64.1% |
| Zimbabweans | 24.7 /100 | #190 | Fair 64.1% |
| Arabs | 24.5 /100 | #191 | Fair 64.1% |
| Lithuanians | 23.8 /100 | #192 | Fair 64.0% |
| French | 23.7 /100 | #193 | Fair 64.0% |
| Paiute | 22.2 /100 | #194 | Fair 64.0% |
| Immigrants | North America | 20.0 /100 | #195 | Poor 64.0% |
| Immigrants | Canada | 19.2 /100 | #196 | Poor 64.0% |
| Seminole | 18.9 /100 | #197 | Poor 64.0% |