Immigrants from Ireland vs Cheyenne Average Family Size
COMPARE
Immigrants from Ireland
Cheyenne
Average Family Size
Average Family Size Comparison
Immigrants from Ireland
Cheyenne
3.13
AVERAGE FAMILY SIZE
0.1/ 100
METRIC RATING
306th/ 347
METRIC RANK
3.47
AVERAGE FAMILY SIZE
100.0/ 100
METRIC RATING
20th/ 347
METRIC RANK
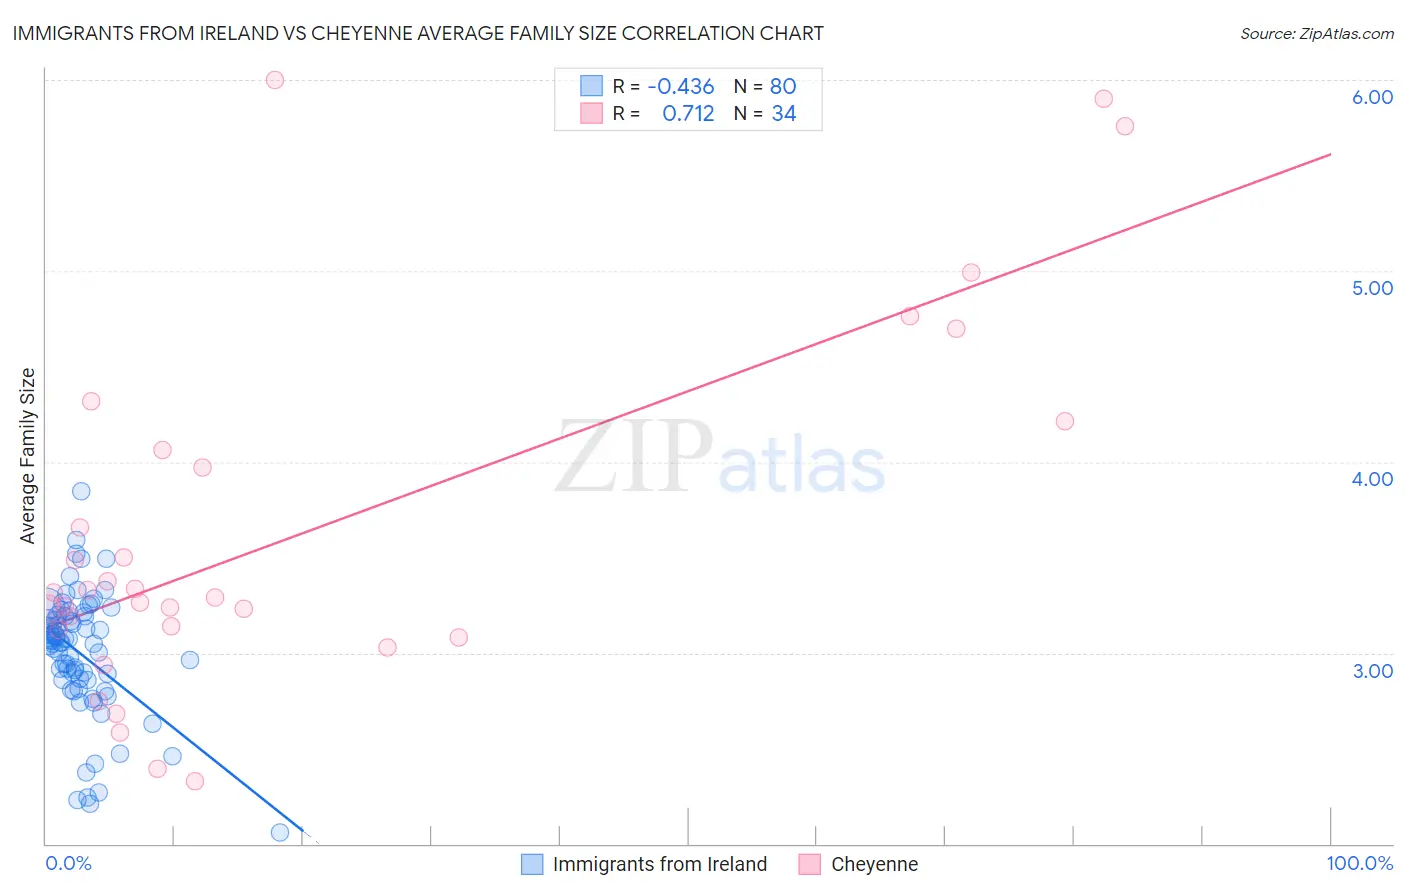
Immigrants from Ireland vs Cheyenne Average Family Size Correlation Chart
The statistical analysis conducted on geographies consisting of 240,751,818 people shows a moderate negative correlation between the proportion of Immigrants from Ireland and average family size in the United States with a correlation coefficient (R) of -0.436 and weighted average of 3.13. Similarly, the statistical analysis conducted on geographies consisting of 80,705,196 people shows a strong positive correlation between the proportion of Cheyenne and average family size in the United States with a correlation coefficient (R) of 0.712 and weighted average of 3.47, a difference of 11.0%.
Average Family Size Correlation Summary
| Measurement | Immigrants from Ireland | Cheyenne |
| Minimum | 2.06 | 2.33 |
| Maximum | 3.85 | 6.00 |
| Range | 1.79 | 3.67 |
| Mean | 2.99 | 3.63 |
| Median | 3.05 | 3.30 |
| Interquartile 25% (IQ1) | 2.86 | 3.12 |
| Interquartile 75% (IQ3) | 3.19 | 4.06 |
| Interquartile Range (IQR) | 0.34 | 0.94 |
| Standard Deviation (Sample) | 0.33 | 0.95 |
| Standard Deviation (Population) | 0.33 | 0.94 |
Similar Demographics by Average Family Size
Demographics Similar to Immigrants from Ireland by Average Family Size
In terms of average family size, the demographic groups most similar to Immigrants from Ireland are Immigrants from Serbia (3.13, a difference of 0.010%), Slavic (3.13, a difference of 0.060%), Northern European (3.13, a difference of 0.060%), Australian (3.13, a difference of 0.070%), and Immigrants from Switzerland (3.13, a difference of 0.090%).
| Demographics | Rating | Rank | Average Family Size |
| Canadians | 0.2 /100 | #299 | Tragic 3.14 |
| Immigrants | Sweden | 0.2 /100 | #300 | Tragic 3.14 |
| Macedonians | 0.2 /100 | #301 | Tragic 3.13 |
| Immigrants | Latvia | 0.2 /100 | #302 | Tragic 3.13 |
| British | 0.2 /100 | #303 | Tragic 3.13 |
| Immigrants | Switzerland | 0.2 /100 | #304 | Tragic 3.13 |
| Australians | 0.1 /100 | #305 | Tragic 3.13 |
| Immigrants | Ireland | 0.1 /100 | #306 | Tragic 3.13 |
| Immigrants | Serbia | 0.1 /100 | #307 | Tragic 3.13 |
| Slavs | 0.1 /100 | #308 | Tragic 3.13 |
| Northern Europeans | 0.1 /100 | #309 | Tragic 3.13 |
| Czechoslovakians | 0.1 /100 | #310 | Tragic 3.13 |
| Immigrants | Northern Europe | 0.1 /100 | #311 | Tragic 3.13 |
| Immigrants | Australia | 0.1 /100 | #312 | Tragic 3.13 |
| Bulgarians | 0.1 /100 | #313 | Tragic 3.13 |
Demographics Similar to Cheyenne by Average Family Size
In terms of average family size, the demographic groups most similar to Cheyenne are Mexican (3.48, a difference of 0.040%), Salvadoran (3.48, a difference of 0.11%), Yuman (3.47, a difference of 0.25%), Apache (3.46, a difference of 0.31%), and Immigrants from El Salvador (3.49, a difference of 0.36%).
| Demographics | Rating | Rank | Average Family Size |
| Sioux | 100.0 /100 | #13 | Exceptional 3.52 |
| Immigrants | Central America | 100.0 /100 | #14 | Exceptional 3.49 |
| Tongans | 100.0 /100 | #15 | Exceptional 3.49 |
| Ute | 100.0 /100 | #16 | Exceptional 3.49 |
| Immigrants | El Salvador | 100.0 /100 | #17 | Exceptional 3.49 |
| Salvadorans | 100.0 /100 | #18 | Exceptional 3.48 |
| Mexicans | 100.0 /100 | #19 | Exceptional 3.48 |
| Cheyenne | 100.0 /100 | #20 | Exceptional 3.47 |
| Yuman | 100.0 /100 | #21 | Exceptional 3.47 |
| Apache | 100.0 /100 | #22 | Exceptional 3.46 |
| Immigrants | Fiji | 100.0 /100 | #23 | Exceptional 3.45 |
| Natives/Alaskans | 100.0 /100 | #24 | Exceptional 3.45 |
| Yakama | 100.0 /100 | #25 | Exceptional 3.45 |
| Native Hawaiians | 100.0 /100 | #26 | Exceptional 3.43 |
| Mexican American Indians | 100.0 /100 | #27 | Exceptional 3.43 |