Hopi vs Cambodian Divorced or Separated
COMPARE
Hopi
Cambodian
Divorced or Separated
Divorced or Separated Comparison
Hopi
Cambodians
13.2%
DIVORCED OR SEPARATED
0.0/ 100
METRIC RATING
304th/ 347
METRIC RANK
11.1%
DIVORCED OR SEPARATED
100.0/ 100
METRIC RATING
35th/ 347
METRIC RANK
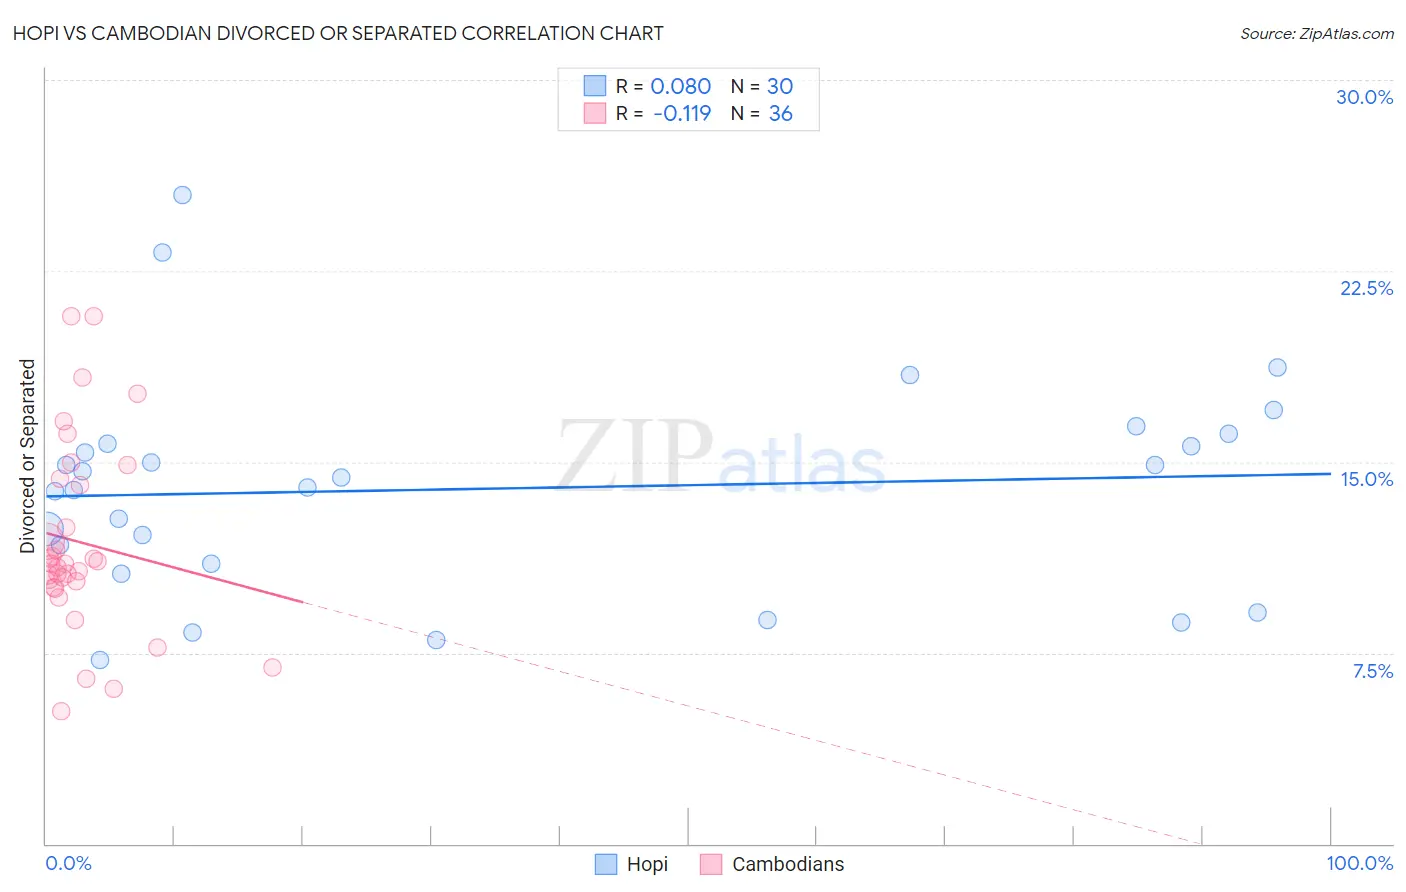
Hopi vs Cambodian Divorced or Separated Correlation Chart
The statistical analysis conducted on geographies consisting of 74,740,168 people shows a slight positive correlation between the proportion of Hopi and percentage of population currently divorced or separated in the United States with a correlation coefficient (R) of 0.080 and weighted average of 13.2%. Similarly, the statistical analysis conducted on geographies consisting of 102,489,900 people shows a poor negative correlation between the proportion of Cambodians and percentage of population currently divorced or separated in the United States with a correlation coefficient (R) of -0.119 and weighted average of 11.1%, a difference of 18.6%.
Divorced or Separated Correlation Summary
| Measurement | Hopi | Cambodian |
| Minimum | 7.2% | 5.2% |
| Maximum | 25.5% | 20.7% |
| Range | 18.3% | 15.5% |
| Mean | 13.9% | 11.8% |
| Median | 14.2% | 11.0% |
| Interquartile 25% (IQ1) | 11.0% | 10.2% |
| Interquartile 75% (IQ3) | 15.7% | 14.2% |
| Interquartile Range (IQR) | 4.7% | 4.0% |
| Standard Deviation (Sample) | 4.2% | 3.7% |
| Standard Deviation (Population) | 4.1% | 3.7% |
Similar Demographics by Divorced or Separated
Demographics Similar to Hopi by Divorced or Separated
In terms of divorced or separated, the demographic groups most similar to Hopi are Chippewa (13.2%, a difference of 0.050%), Cape Verdean (13.1%, a difference of 0.13%), Immigrants from Venezuela (13.1%, a difference of 0.15%), Tlingit-Haida (13.2%, a difference of 0.22%), and Alaskan Athabascan (13.1%, a difference of 0.25%).
| Demographics | Rating | Rank | Divorced or Separated |
| Natives/Alaskans | 0.0 /100 | #297 | Tragic 13.0% |
| Venezuelans | 0.0 /100 | #298 | Tragic 13.0% |
| Immigrants | Jamaica | 0.0 /100 | #299 | Tragic 13.0% |
| Immigrants | Cabo Verde | 0.0 /100 | #300 | Tragic 13.1% |
| Alaskan Athabascans | 0.0 /100 | #301 | Tragic 13.1% |
| Immigrants | Venezuela | 0.0 /100 | #302 | Tragic 13.1% |
| Cape Verdeans | 0.0 /100 | #303 | Tragic 13.1% |
| Hopi | 0.0 /100 | #304 | Tragic 13.2% |
| Chippewa | 0.0 /100 | #305 | Tragic 13.2% |
| Tlingit-Haida | 0.0 /100 | #306 | Tragic 13.2% |
| French American Indians | 0.0 /100 | #307 | Tragic 13.2% |
| Ottawa | 0.0 /100 | #308 | Tragic 13.2% |
| Americans | 0.0 /100 | #309 | Tragic 13.2% |
| Africans | 0.0 /100 | #310 | Tragic 13.2% |
| Sioux | 0.0 /100 | #311 | Tragic 13.2% |
Demographics Similar to Cambodians by Divorced or Separated
In terms of divorced or separated, the demographic groups most similar to Cambodians are Immigrants from Japan (11.1%, a difference of 0.060%), Immigrants from Lebanon (11.1%, a difference of 0.070%), Immigrants from Uzbekistan (11.1%, a difference of 0.080%), Immigrants from Greece (11.1%, a difference of 0.13%), and Egyptian (11.1%, a difference of 0.15%).
| Demographics | Rating | Rank | Divorced or Separated |
| Immigrants | Malaysia | 100.0 /100 | #28 | Exceptional 11.0% |
| Armenians | 100.0 /100 | #29 | Exceptional 11.0% |
| Immigrants | Ireland | 100.0 /100 | #30 | Exceptional 11.0% |
| Mongolians | 100.0 /100 | #31 | Exceptional 11.1% |
| Tongans | 100.0 /100 | #32 | Exceptional 11.1% |
| Egyptians | 100.0 /100 | #33 | Exceptional 11.1% |
| Immigrants | Uzbekistan | 100.0 /100 | #34 | Exceptional 11.1% |
| Cambodians | 100.0 /100 | #35 | Exceptional 11.1% |
| Immigrants | Japan | 100.0 /100 | #36 | Exceptional 11.1% |
| Immigrants | Lebanon | 100.0 /100 | #37 | Exceptional 11.1% |
| Immigrants | Greece | 100.0 /100 | #38 | Exceptional 11.1% |
| Immigrants | Egypt | 100.0 /100 | #39 | Exceptional 11.1% |
| Soviet Union | 100.0 /100 | #40 | Exceptional 11.1% |
| Bhutanese | 100.0 /100 | #41 | Exceptional 11.2% |
| Chinese | 100.0 /100 | #42 | Exceptional 11.2% |